
|
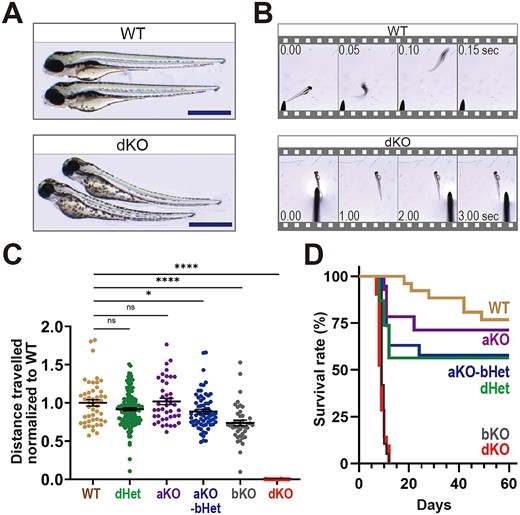
Fig. 2 Characterization of cacna1s mutant larvae. (A) Representative bright field images of 4 dpf embryos. A total of 10 embryos per group were imaged. cacna1s-dKO larvae exhibited curved body axis. Scale bars = 1 mm. (B) Representative snapshots of touch-evoked response of 4 dpf larvae. A total of five fish per group were captured for video. WT zebrafish swim away rapidly after touch stimulation, while cacna1s-dKO showed no response or movement (see also Supplement Movies). (C) Quantification of motor ability of mutant fish (6 dpf). Total distance traveled during photochemical activation was normalized to the average of WT siblings and plotted (WT; n = 48, dHet; n = 136, aKO; n = 42, aKO-bHet; n = 69, bKO; n = 43, dKO; n = 28). Values are Mean � SEM (mm); WT (1.00 � 0.04), dHet (0.92 � 0.02), aKO (1.02 � 0.04), aKO-bHet (0.89 � 0.03), bKO (0.74 � 0.04), dKO (0.00 � 0.00). Statistical analysis by one-way ANOVA followed by Dunnett?s multiple comparisons tests where P < 0.05 (*) and P < 0.0001 (****). (D) Kaplan-Meier curve showing reduced survival in cacna1s-dKO (n = 21, median survival = 9 days) and cacna1s-bKO (n = 19, median survival = 9 days, gray), but not in cacna1s-dHet (n = 23), cacna1s-aKO-bHet (n = 19), cacna1s-aKO (n = 14) or WT siblings (n = 26). Log-rank test: WT vs dKO; P < 0.0001, WT vs bKO; P < 0.0001, WT vs aKO; P = 0.2830, WT vs dHet; P = 0.1171, WT vs aKO-bHet; P = 0.1213.