Fig. 9
- ID
- ZDB-FIG-240329-53
- Publication
- Endo et al., 2023 - Two zebrafish cacna1s loss-of-function variants provide models of mild and severe CACNA1S-related myopathy
- Other Figures
- All Figure Page
- Back to All Figure Page
|
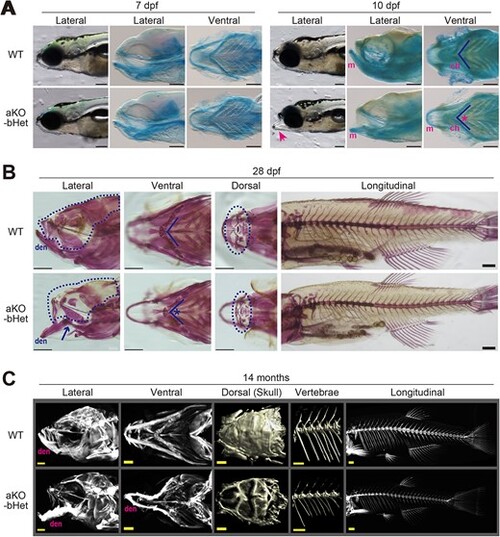
Morphological analysis on cacna1s-aKO-bHet. (A) At 7dpf, bright field (left) and alcian blue staining images (middle and right) showed no obvious difference between WT and aKO-bHet mutants in mandible development. At 10 dpf, aKO-bHet mutants could be recognized by protruding jaw (arrow). Meckel’s cartilage of mutants were dislocated as dropping in the lateral view of alcian blue staining, and ceratohyal angle (asterisk) of mutants was narrower than that of WT. The angle between the two ceratohyal elements is highlighted (right most panels, chevron shaped line). Abbreviations: m, Meckel’s cartilage; Ch, ceratohyal bone. Scale bars: 200 μm. A total of 8 larvae per group were imaged. (B) Representative imaging of WT and aKO-bHet stained with alizarin red at 28 dpf. Lateral view of mutant revealed the jaw joint (arrow) positioned upward therefore the dentary bones downturned. The ossification of the craniofacial bones in upper jaw and skull (dashed lines in lateral and dorsal views) were severely decreased in aKO-bHet mutants compared to WTs. The ceratohyal angle (asterisk) of mutants was narrower than that of WT, and non-progressive compared to that of 10 dpf. There was no difference in spinal formation and mineralization between WT and mutants, while vertebrae and fin rays of mutants were thinner than that of WT in the longitudinal view. Abbreviations: den, dentary bone. Scale bars: 500 μm. A total of 8 samples per group were imaged. (C) The micro-CT reconstruction images of WT and aKO-bHet mutant at the age of 14 months. Lateral view of mutant exhibited that the dentary bone was dislocated with increased calcification and irregular margins, and that upper jaw elements were smaller than that of WT. Ventral view of mutant showing significantly narrowed snout, mouth, and jaw due to the deformity of mandibular bones. Dorsal view of mutant’s skulls displays a lower density compared to WT. The vertebrae and spine of mutant were thin and shortened, corresponding to the body size. Abbreviations: den, dentary bone. Scale bars: 1 mm. A total of 2 samples per group were analyzed. |

