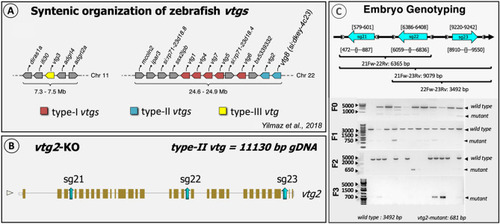
Schematic representation of the general strategy for CRISPR target design. (A) Synthetic organization of vtg genes on zebrafish genome (from3). (B) Target locations on zebrafish vtg2 genomic structure. Target sites are shown by blue colored arrows labeled as “sg” for single guide RNA followed by 1, 2, or 3 indicating the targeted zebrafish vtg type and the number of the target site (i.e., sg21, sg22, and sg23). (C) Detection of CRISPR/Cas9-introduced mutation by embryo genotyping. Target sites are shown by blue colored arrows labeled as indicated for Panel B. Arrows are oriented to indicate the sense/antisense orientation of each target. Numbers above each target site specify its exact location by nucleotide in the genomic sequence of the zebrafish vtg2. Primers used in screening for introduced mutations by PCR are shown as grey arrowheads which are oriented to indicate the sense/antisense orientation of the primer. Numbers below each primer site indicate its exact position by nucleotide in the genomic sequence of the targeted gene (see also S1 Fig). Horizontal brackets below indicate areas screened for mutations by PCR using selected primer combinations; text below the brackets indicates the primer pair followed by the size of the band (bp) expected for wild type gDNA in agarose gel electrophoresis. 21Fw, vtg2 target1 forward primer; 22Rv, vtg2 target2 reverse primer; 23Rv, vtg2 target3 reverse primer; 22Fw, vtg2 target2 forward primer. Primer sequences are given in S3 Table. The bottom left panel illustrates genotyping of embryos at 24 h post-fertilization (hpf) by PCR for vtg2-mutant line, from the F0 to F3 generation. F0 indicates the generation reared from microinjected embryos and F1-3 represent offspring raised from each subsequent generation. The agarose gel electrophoresis results shown here represent screening of 10–17 randomly sampled embryos as representatives of their generations. Bands comprised of wild type intact gDNA (3492 bp) and mutated gDNA (681 bp) are shown and highlighted by black arrowheads on the right side of each panel.

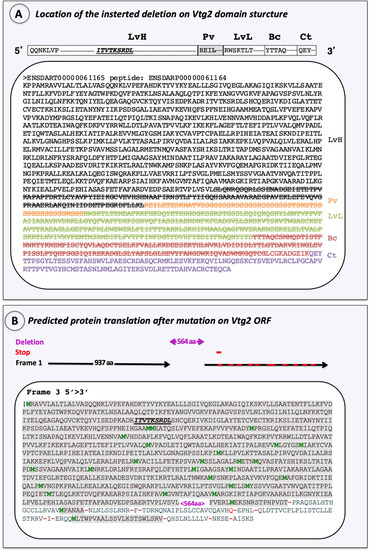
Characterization of the introduced mutation. (A) Location on Vtg2 polypeptide structure. The yolk protein domain structure of Vtg2 is pictured in 5′ > 3′ orientation above panel. Horizontal bars represent the heavy and light chain lipovitellins (LvH, LvL), phosvitin (Pv), beta component (Bc), and C-terminal (Ct) domains of the Vtg2 and are labeled above in large bold type. Sequences within these bars indicate the N-terminus of each yolk protein domain, the starting points of which are also indicated by shade color change to the polypeptide sequence shown below. Each domain is labeled to the right with the corresponding shade color. LvH: black, Pv: orange, LvL: light green, Bc: red, Ct: purple. Cas9 created mutations (large deletions) are indicated with stroked letters representing amino acid (aa) residues. (B) Frameshift caused by the introduced mutation on the Vtg2 open reading frame. A total of 973 aa which were not altered by the introduced mutation are indicated in grey shaded letters. The introduced mutation of 564 aa is indicated in magenta font set (<564 aa>). Methionine residues are shown in green font set and “stop codons” are indicated by red dashes. The receptor binding site is indicated by bold, italic and, underlined aa motif.

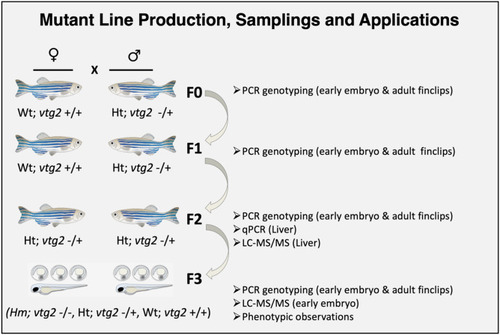
Production of F3 generation vtg2-mutants and samplings. The general strategy followed to establish zebrafish vtg2-mutant lines is shown above. This process involved stepwise reproductive crosses (indicated by X) between males (♂) and females (♀) indicated here with zebrafish icons. F0-3 represents the zebrafish generations produced in the process. Biological samples and the applications for which they were used are indicated on the right side of the panel. Wt; vtg2 +/+, wild type fish with two vtg2 alleles, Ht; vtg2 −/+, heterozygous fish carrying only one vtg2 allele, Hm; vtg2 −/−, homozygous fish lacking both vtg2 alleles.

Relative quantification of vtg2 gene expression in F2 vtg2-mutant zebrafish female liver and Vtg2 protein abundance in 1 hpf F3 vtg2-mutant embryos. (A) Comparison of vtg2 gene expression levels in F2 vtg2-mutant (Ht; vtg2 −/+) and wild type (Wt) female liver in dark and light gray vertical bars, respectively. Vertical brackets indicate SEM. SYBR Green qPCR-2−ΔΔCT mean relative quantification of gene expression normalized to the geometric mean expression of zebrafish elongation factor 1a (eif1a) and ribosomal protein L13a (rpl13a) was employed. Data were statistically analyzed using a Kruskal Wallis nonparametric test p < 0.05. (B) Relative quantification of multiple vitellogenins by LC–MS/MS in F2 vtg2-mutant female (Ht; vtg2 −/+) liver, and (C) Relative quantification of multiple vitellogenins by LC–MS/MS in 1 hpf F3 vtg2-mutant embryos. Comparisons of mean normalized spectral counts for Vtg protein levels in Wt versus vtg2-mutants indicated by dark and light gray vertical bars, respectively. Vertical brackets indicate SEM. Statistically significant differences between group means detected by independent samples Kruskal Wallis non-parametric test (p < 0.05) are indicated by asterisks above bars.

Phenotypic measurements of F2 vtg2-mutant females and their F3 progeny. Vertical bar graphs indicate mean values (± SEM) for measurements of (A) number of eggs per spawn in F2 vtg2-mutant versus wild type females, (B) egg fertilization rates in F2 vtg2-mutant versus wild type females, and (C) embryo hatching percentages at 48, 72 and 96 hpf in F3 vtg2-mutant versus wild type offspring. Labels below the x-axes indicate the groups that were compared with the number of tested batches indicated in parentheses. Black stars, in all graphs, indicate mean values that are significantly different from corresponding Wt mean values based upon results of an independent samples t-test (p < 0.05).

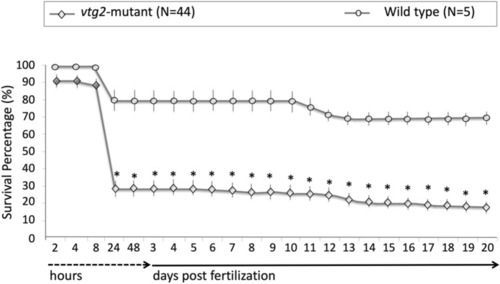
Comparisons of survival percentages for F3 vtg2-mutants versus wild type zebrafish offspring. Line plots represent mean survival percentages and numbers on the x-axis accompanied by dashed- and solid-lined arrows represent sampling times in hours or days post fertilization during the observation period. Mean survival percentages for vtg2-mutants and Wt embryos and larvae at each time point are indicated by diamonds and circles, respectively, and vertical lines indicate SEM. Asterisks indicate mean values that are significantly different from the corresponding mean Wt values based on results of the independent samples t-test (p < 0.05).

PHENOTYPE:
Fish:
Observed In:
Stage Range: 64-cell to Days 14-20

Observed phenotypes of F3 vtg2-mutant offspring compared to wild type offspring. (A) vtg2-mutant embryos with leaking yolk at 1 hpf. (B) vtg2-mutant embryos with abnormal cell division at 2 hpf. (C) Wt versus vtg2-mutant embryos at 4 dpf. (D) Wt versus vtg2-mutant embryos at 8 dpf. *Wt embryos are indicated by asterisks.

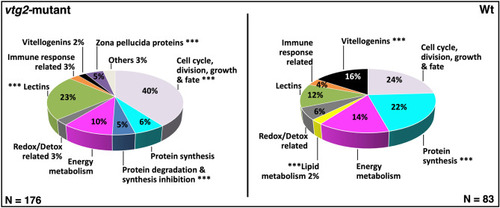
Percent distribution of DEPs. Distribution of differentially regulated proteins among functional categories. Left Panel Proteins downregulated in vtg2-mutant offspring (upregulated in Wt, N = 83). Right Panel Proteins upregulated in vtg2-mutant offspring (N = 176). Only proteins that were identified in > 4 biological samples and that exhibited a ≥ 1.0-fold difference in N-SC between groups (vtg2-mutant versus Wt), or proteins unique to a certain group, were included in this analysis. The overall distribution of differentially regulated proteins among the functional categories significantly differed between mutant and Wt eggs (χ2, p < 0.05). Asterisks indicate significant differences between different groups in the proportion of differentially regulated proteins within a functional category (χ2, p < 0.05). The corresponding Ensembl Protein IDs and associated gene, transcript and protein names, functional categories (shown above), regulation (upregulated or downregulated in mutant compared to Wt), and fold-difference in N-SC between vtg2-mutant and Wt eggs for proteins included in this analysis are given in S1 Table.

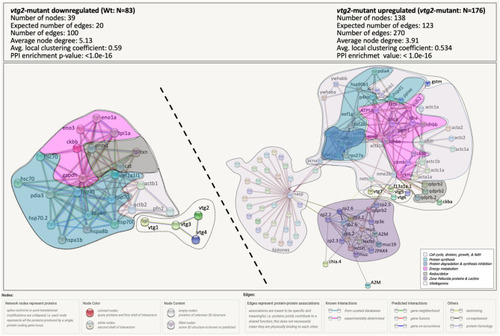
STRING Network Analysis of the differentially regulated proteins in vtg2-mutant eggs. A total of 83 proteins that were downregulated in vtg2-mutant eggs and 176 proteins that were upregulated in vtg2-mutant eggs were over-represented in specific biological pathways (S2 Table). Each network node (sphere) represents all proteins produced by a single, protein-coding gene locus (splice isoforms or post-translational modifications collapsed). Only nodes representing query proteins are shown. Nodes are named for the transcript(s) to which spectra were mapped; for full protein names, see S1 Table. Edges (colored lines) represent protein–protein associations meant to be specific and meaningful, e.g., proteins jointly contribute to a shared function but do not necessarily physically interact. Protein clusters of similar functions are framed and highlighted with the same colors of functional categories in Fig. 8. Color codes of these categories are given in the bottom left corner of the right panel. Model statistics are presented at the top left and the top right of each panel for proteins down- and up-regulated in mutant eggs, respectively. An explanation of edge colors is given below panels. The subnetwork formed by proteins downregulated in mutant eggs is shown to the upper left above the diagonal dashed line, and the subnetwork formed by proteins upregulated in mutant eggs is shown to the lower right below the diagonal dashed line. Where possible, dashed lines encircle clusters of transcripts encoding interacting proteins involved in physiological processes distinct from other such clusters.

Acknowledgments
This image is the copyrighted work of the attributed author or publisher, and ZFIN has permission only to display this image to its users. Additional permissions should be obtained from the applicable author or publisher of the image. Full text @ Sci. Rep.