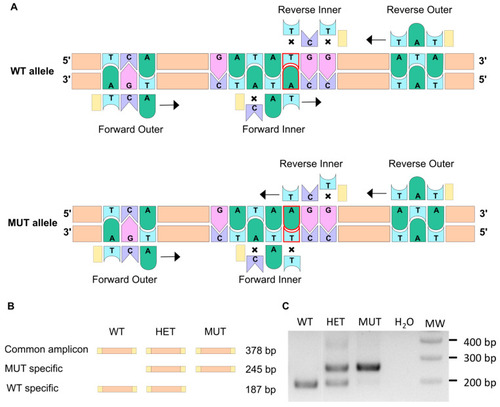
The ARMS-PCR technique allows to discriminate between WT and mutant alleles. (A) The ARMS-PCR principle is illustrated here. The single point mutation in the elnasa12235 mutant corresponds to the substitution of thymine into an adenine (delineated in red). Two pairs of primers are used so that PCR amplification does not lead to the same result for WT and mutant alleles. Crosses symbolize a mismatch between the primer and the DNA sequence. When two mismatches are found at the 3′ extremity of the primer, the elongation cannot happen. When only one mismatch is present, transcription can occur (black arrow). (B) Schematic representation of amplicons generated through ARMS-PCR. (C) Gel electrophoresis of the PCR amplification products enables the genotype to be revealed for WT (wild type), HET (heterozygous), or MUT (mutant) individuals.

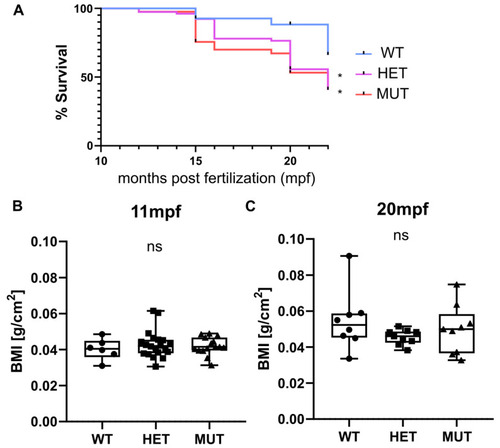
elna mutants have a shorter life expectancy. (A) Zebrafish survival from 3 independent clutches resulting from the crossing of heterozygous (elna sa12235/+) fish was recorded after genotyping, from 10–11 mpf to 15–22 mpf (WT = 27; HET = 78; MUT = 41 zebrafish). Survival curves were compared using the log-rank Mantel-Cox test and the Log-rank test for trend; * p < 0.05. (B,C) Weight and size of fish were measured at 11 and 20 mpf and expressed as a body mass index (BMI). Data were analyzed by Kruskal–Wallis test; ns = non-significant; mpf = months post fertilization; WT = wild type (elna+/+); HET = heterozygous (elna sa12235/+); MUT = mutant (elna sa12235/ sa12235).

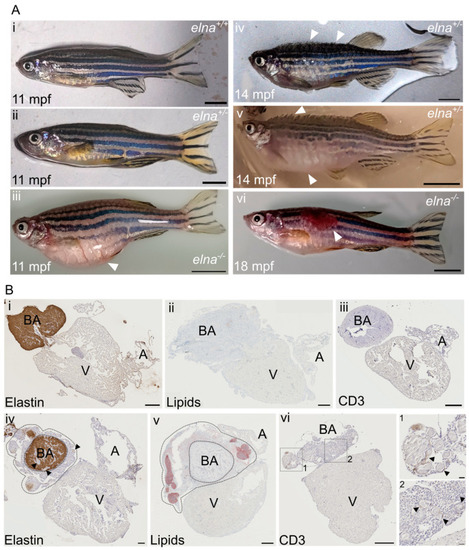
elnasa12235/+ and elnasa12235/sa12235 mutants suffer from severe cardiac complications. (A) Mutant zebrafish from 9 mpf were found to undergo complications such as (iii) an important swelling of the belly unrelated to stuck eggs; (iv,v) swelling of the entire body and protrusion of the scales with a rapid aggravation; (iv) early stage; (v) late stage; (vi) ulcers on their body; (i,ii) show normal fish of the same age. White arrows point to major observations of each image; scale bar = 0.5 cm. (B) Histological sections from (i,iii) normal or (ivvi) pathological hearts from sick fish with protruding scales (here from elnasa12235/+ fish) were labeled for (i,iv) elastin; (ii,v) lipids; and (iii,vi) CD3e. In (iv) and (v), dotted lines encircle the dysplastic tissue surrounding the bulbus arteriosus; black arrows point to “nodule-like” structures found in the pathological hearts; scale bar = 200 µm, except for zooms in vi-1 and vi-2, where scale bar = 20 µm. BA = bulbus arteriosus; V = ventricle; A = atrium; mpf = months post fertilization.

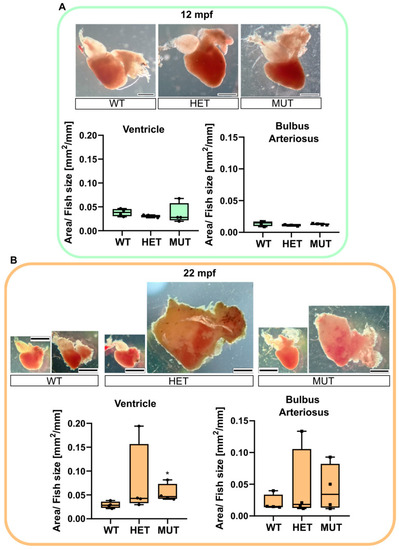
elna mutants are subject to cardiomegaly with age. Zebrafish hearts were collected from apparently healthy fish at 12 (A) or 22 (B) mpf (n = 4 fish per genotype and age). Representative images are shown for each genotype. The area of the ventricle and the bulbus arteriosus (including dysplastic tissue) was measured in each heart and reported, normalized with the size of the fish. Data were analyzed by Kruskal–Wallis with Dunn’s multiple comparison test; * p < 0.05. Scale bar = 0.5 mm. mpf = months post fertilization; WT = wild type (elna+/+); HET = heterozygous (elnasa12235/+); MUT = mutant (elnasa12235/sa12235).

PHENOTYPE:
Fish:
Observed In:
Stage: Adult

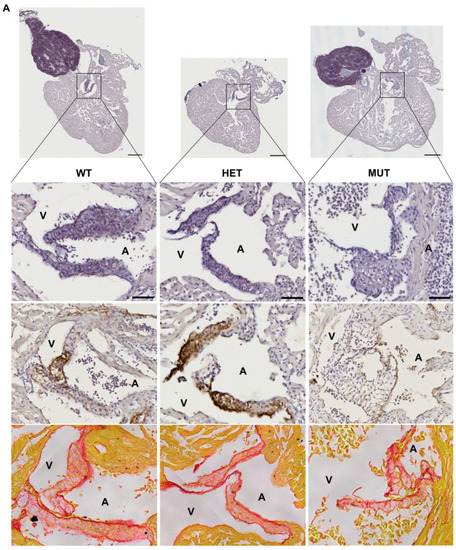
elna mutants show abnormal cardiac valves. (A,B) Histological images of the complete heart sections (orcein) and a zoom of the A-V valve (A) or BA-V valve (B) from 12 months post fertilization fish stained with orcein (first row), immunolabeled with anti-elastin antibodies (second row), or stained with picrosirius red (third row). (C) Quantification of “honeycomb-like” structures referred to as alveolate areas in valves from histological sections of zebrafish hearts. Each point is the result of one leaflet of the valve. Circles are for A-V valves, and squares are for V-BA valves. Four fish per genotype were analyzed; however, all their valves were not always visible enough to perform the analysis. (D) Global aspect of each valve leaflet was categorized as normal or pathological when the shape was unusual and the alveolate area exceeded 20% of the total surface. Scale bar = 200µm for complete heart sections and 40µm for valve images; A = atrium; V = ventricle; BA = bulbus arteriosus; SV = sinus venosus; A-V = atrio-ventricular; V-BA = ventriculo-bulbar; WT = wild type (elna+/+); HET = heterozygous (elnasa12235/+); MUT = mutant (elnasa12235/sa12235); Kruskall–Wallis test was performed followed by Dunnett’s post hoc test in (C); ns = not significant.

Acknowledgments
This image is the copyrighted work of the attributed author or publisher, and ZFIN has permission only to display this image to its users. Additional permissions should be obtained from the applicable author or publisher of the image. Full text @ Cells