- Title
-
Dysfunction of Prkcaa Links Social Behavior Defects with Disturbed Circadian Rhythm in Zebrafish
- Authors
- Hu, H., Long, Y., Song, G., Chen, S., Xu, Z., Li, Q., Wu, Z.
- Source
- Full text @ Int. J. Mol. Sci.
|
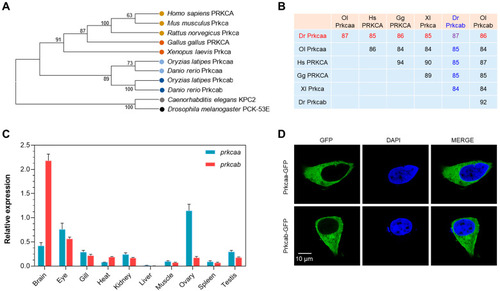
Molecular characterization of zebrafish Prkcaa and Prkcab. (A) A phylogenetic tree for PRKCA (or Prkcaa and Prkcab). The sequence accession numbers are listed in Table S1. (B) Amino acid sequence identity between PRKCA (or Prkcaa and Prkcab). Dr, Danio rerio; Gg, Gallus gallus; Hs, Homo sapiens; Ol, Oryzias latipes; Xl, Xenopus laevis. Sequence identities between Dr Prkcaa and the others are shown in red, and those for Dr Prkcab are shown in blue. (C) Tissue expression patterns of zebrafish prkcaa and prkcab. The y-axis represents the expression of prkcaa and prkcab normalized to that of 18s rRNA. The error bar stands for standard deviation of 3 technical replicates. (D) Subcellular localization of zebrafish Prkcaa and Prkcab expressed in the HEK293T cells. |
|
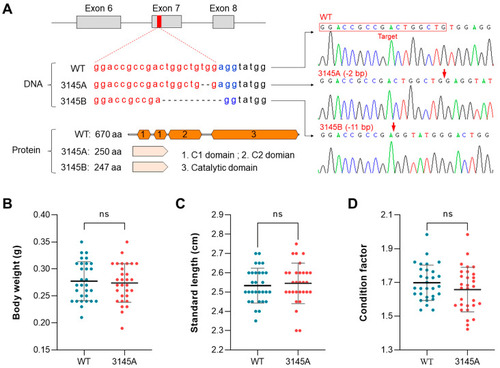
Genotypes and body measurements of the prkcaa-null zebrafish. (A) Genotypes of the prkcaa−/− mutants. The target sequence was located in the seventh exon of the zebrafish prkcaa gene. Two mutant lines were generated and designated as ZKO3145A (3145A, −2 bp) and ZKO3145B (3145B, −11 bp). The target sequence, deleted nucleotides and the truncated proteins are illustrated. The red arrows indicate the joining sites of the broken DNA strands. (B–D) Measurements include body weight (B), standard length (C) and condition factor (D) for the adults of the WT and 3145A mutants. The error bars represent standard error (n = 30); ns, no significant difference. The different colored lines represent the four bases, A, T, C and G (shown above the lines). The different colored dots indicate the fish lines WT and 3145A (shown below the x-axis). |
|
The prkcaa−/− mutants demonstrated anxiety-like behavior. (A) A diagram for the novel tank. The tank was divided into 2 parts with a dashed red line: the top and the bottom. The numbers indicate tank size and water depth (cm). (B) Representative tracked trajectories of the WT and 3145A fish. The red and green line segments represent large (>15 cm/s) and moderate (1–15 cm/s) movements, respectively. (C) Total freezing time. (D) Average velocity. (E) Latency to enter the top. (F) Number of entries into the top. (G) Time spent in the top. (H) Distance traveled in the top. The error bars represent standard error (n = 30). **, p < 0.01; ***, p < 0.001. |
|
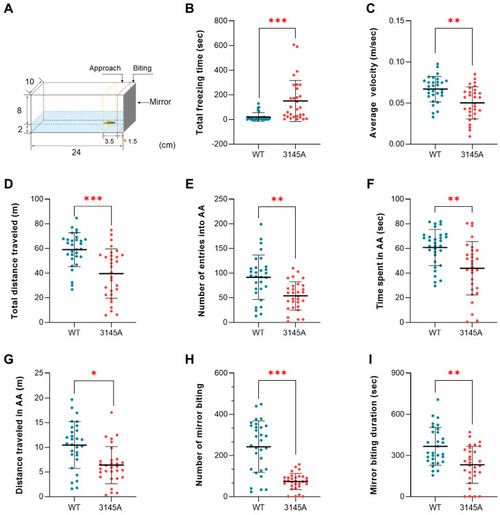
Loss of prkcaa decreased aggressiveness of zebrafish. (A) An illustration for the mirror biting test. The region adjacent to the mirror (1.5 cm from the mirror, dashed red line) is the mirror contact (mirror biting) area. That indicated by the dashed yellow line (1.5–5 cm from the mirror) is the approach area (AA). The numbers indicate the size of the aquarium (cm). (B) Total freezing time. (C) Average velocity. (D) Total distance traveled. (E) Number of entries into AA. (F) Time spent in AA. (G) Distance traveled in AA. (H) Number of mirror biting. (I) Mirror biting duration. The error bars represent standard error (n = 30). *, p < 0.05; **, p < 0.01; ***, p < 0.001; ns, no significant difference. |
|
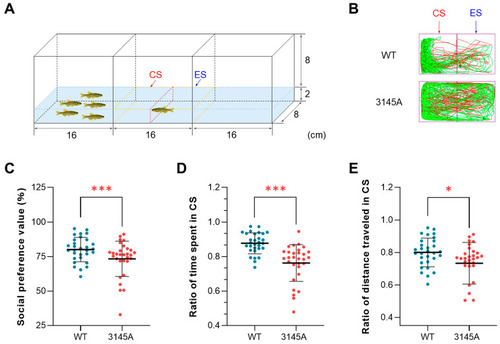
Dysfunction of Prkcaa attenuated the social preference of zebrafish. (A) A diagram for the social preference test. The region enclosed by the dashed yellow line is the video recording area, which is divided into the conspecific sector (CS) and the empty sector (ES) in the middle (the dashed red line). The numbers indicate the size of the tank (cm). (B) Representative tracked trajectories of the WT and 3145A fish. The red and green line segments represent large (> 15 cm/s) and moderate (1–15 cm/s) movements, respectively. (C) Social preference value. (D) Ratio of time spent in the CS. (E) Ratio of distance traveled in the CS. The error bars represent standard error (n = 30). *, p < 0.05; ***, p < 0.001. |
|
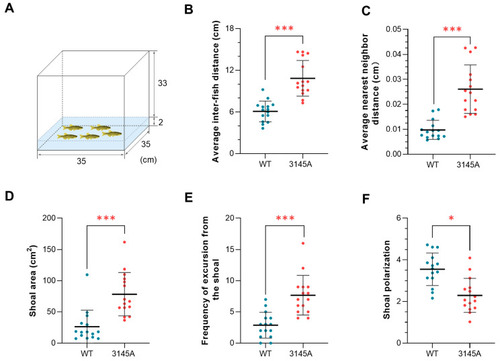
Deficiency in Prkcaa impaired the shoaling behavior of zebrafish. (A) An illustration of the shoaling test. The numbers indicate the size of the tank (cm). (B) Average interfish distance. (C) Average nearest neighbor distance. (D) Shoal area. (E) Frequency of excursion from the shoal. (F) Shoal polarization. The fish were analyzed in groups (each group included 5 individuals), and 15 groups were analyzed for each of the fish lines. The error bars represent standard error (n = 15). *, p < 0.05; ***, p < 0.001. |
|
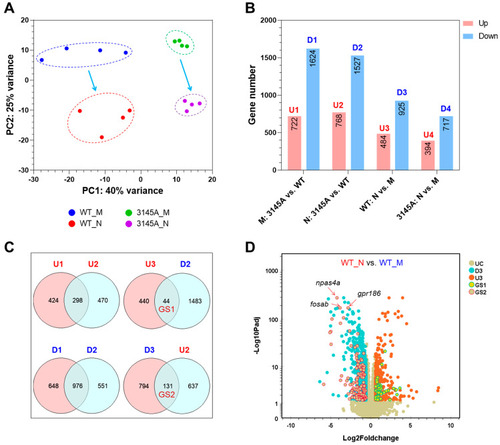
Effects of prkcaa mutation on gene expression. (A) Results of PCA. The proportion of variance explained by the first two PCs is displayed. (B) Numbers of the differentially expressed genes (DEGs). U1 to U4, the upregulated (up) gene sets; D1 to D4, the downregulated (down) gene sets. M and N represent the sampling time; M, morning (9:00 a.m.); N, night (9:00 p.m.). (C) Venn diagrams indicating the intersection between the gene sets. GS1 and GS2 represent the circadian genes regulated by the prkcaa mutation. (D) A volcano plot demonstrating the DEGs of the indicated gene sets. UC, unchanged; D3 and U3, the same as in (B); GS1 and GS3, the same as in (C). The representative circadian genes downregulated at night and upregulated by the prkcaa mutation are indicated. |
|
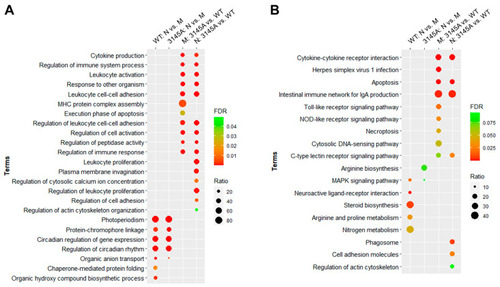
Top GO biological process and KEGG pathway enrichments for the DEGs. (A) Top GO biological process terms. (B) Top KEGG pathway terms. FDR, false discovery rate; ratio, proportion of the DEGs to all the genes associated with the corresponding functional term. Only terms with FDR < 0.05 are shown. |
|
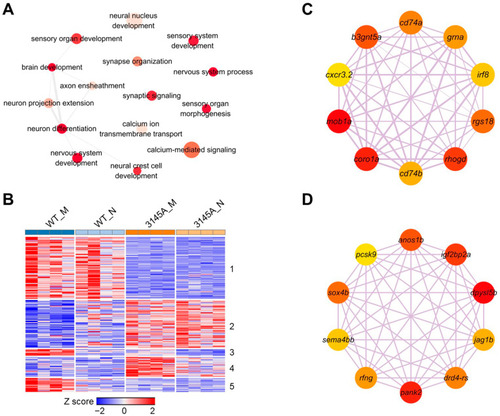
The genes affected by Prkcaa dysfunction and involved in neuron development and neural activity. (A) A network of the GO terms associated with neuron development and neural activity. The DEGs between WT and 3145A (both in morning and at night) were combined and subjected to GO enrichment analysis. Redundancy of the GO term list was removed by Revigo. Depth of color represents the p-value, and size of the nodes illustrates ratio of the DEGs associated with the corresponding GO term. (B) A heatmap demonstrating expression patterns of the genes affected by Prkcaa dysfunction and involved in neural functions. The genes were clustered into 5 clusters through the K-means method. (C) The Hub genes of cluster 1. (D) The Hub genes of cluster 2. Depth of color represents the p-value, and size of the nodes illustrates ratio of the DEGs associated with the corre-sponding GO term. |
|
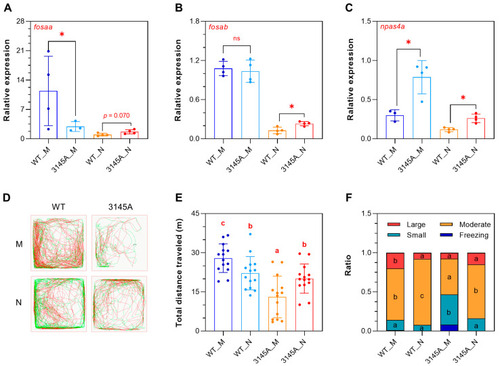
The prkcaa mutants are more active at night. (A–C) Expression of the representative circadian genes determined by qPCR. (A) fosaa, (B) fosab, (C) npas4a. (D) Representative tracked trajectories of the fish in the morning and at night. The red and green line segments represent large (>15 cm/s) and moderate (1–15 cm/s) movements, respectively. M, morning (9:00–11:00 a.m.); N, night (9:00–11:00 p.m.). (E) Total distance traveled. (F) Time ratio of the speed-based movement categories. The error bars represent standard error (n = 14). Different letters overlaid on the bar segments indicate significant difference between the means (* p < 0.05). |

