Figure 5
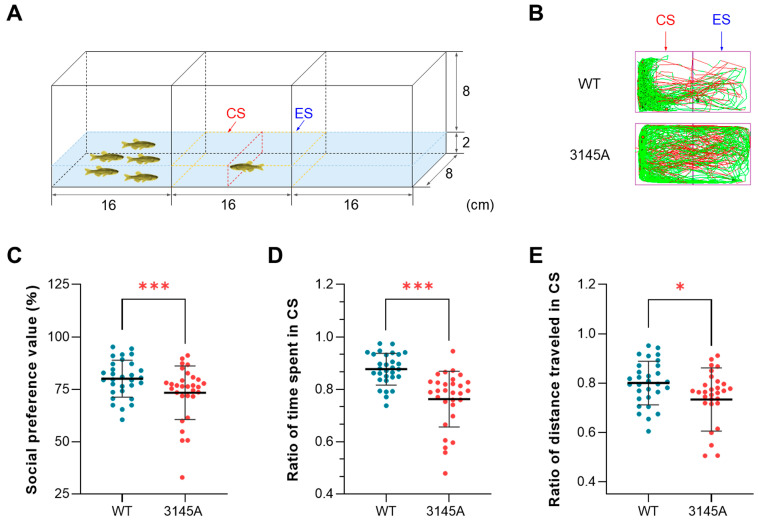
Dysfunction of Prkcaa attenuated the social preference of zebrafish. (A) A diagram for the social preference test. The region enclosed by the dashed yellow line is the video recording area, which is divided into the conspecific sector (CS) and the empty sector (ES) in the middle (the dashed red line). The numbers indicate the size of the tank (cm). (B) Representative tracked trajectories of the WT and 3145A fish. The red and green line segments represent large (> 15 cm/s) and moderate (1–15 cm/s) movements, respectively. (C) Social preference value. (D) Ratio of time spent in the CS. (E) Ratio of distance traveled in the CS. The error bars represent standard error (n = 30). *, p < 0.05; ***, p < 0.001.

