Figure 4
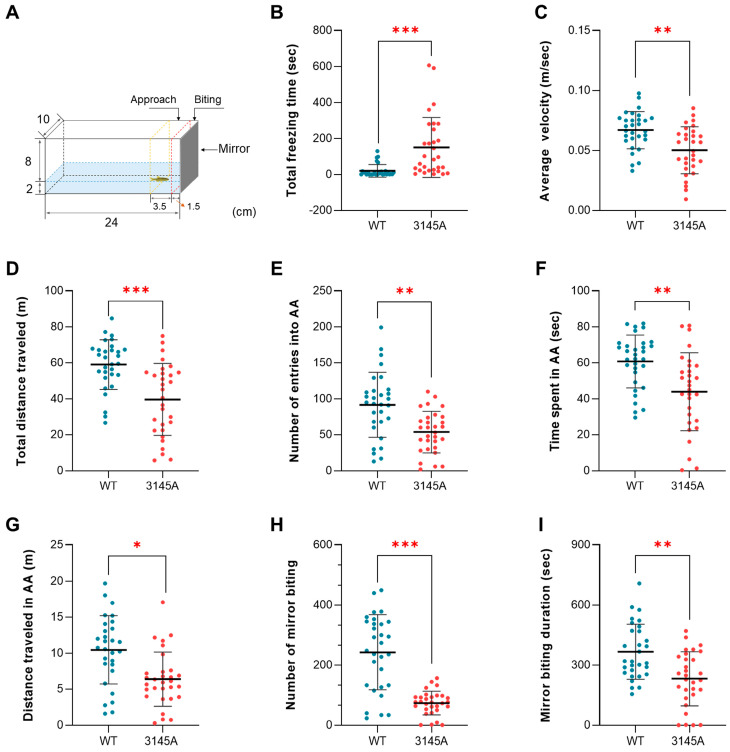
Loss of prkcaa decreased aggressiveness of zebrafish. (A) An illustration for the mirror biting test. The region adjacent to the mirror (1.5 cm from the mirror, dashed red line) is the mirror contact (mirror biting) area. That indicated by the dashed yellow line (1.5–5 cm from the mirror) is the approach area (AA). The numbers indicate the size of the aquarium (cm). (B) Total freezing time. (C) Average velocity. (D) Total distance traveled. (E) Number of entries into AA. (F) Time spent in AA. (G) Distance traveled in AA. (H) Number of mirror biting. (I) Mirror biting duration. The error bars represent standard error (n = 30). *, p < 0.05; **, p < 0.01; ***, p < 0.001; ns, no significant difference.

