Figure 9
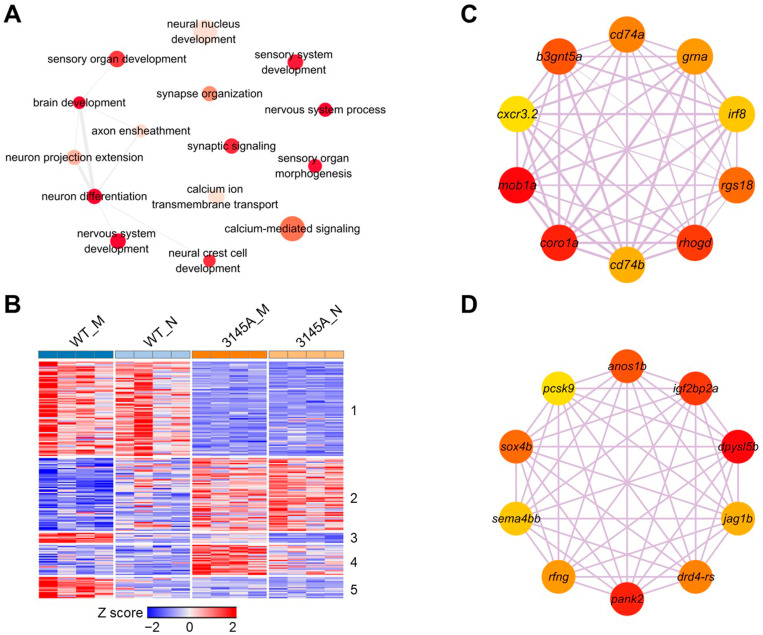
The genes affected by Prkcaa dysfunction and involved in neuron development and neural activity. (A) A network of the GO terms associated with neuron development and neural activity. The DEGs between WT and 3145A (both in morning and at night) were combined and subjected to GO enrichment analysis. Redundancy of the GO term list was removed by Revigo. Depth of color represents the p-value, and size of the nodes illustrates ratio of the DEGs associated with the corresponding GO term. (B) A heatmap demonstrating expression patterns of the genes affected by Prkcaa dysfunction and involved in neural functions. The genes were clustered into 5 clusters through the K-means method. (C) The Hub genes of cluster 1. (D) The Hub genes of cluster 2. Depth of color represents the p-value, and size of the nodes illustrates ratio of the DEGs associated with the corre-sponding GO term.

