Image
Figure Caption
Figure 6
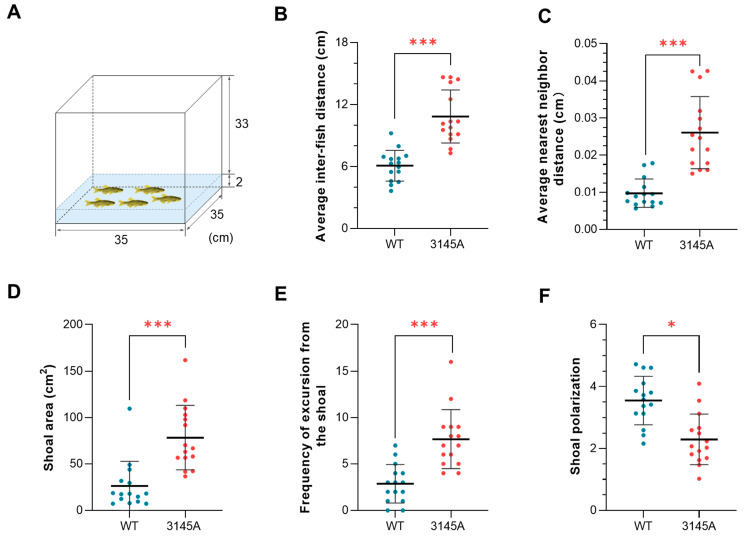
Deficiency in Prkcaa impaired the shoaling behavior of zebrafish. (A) An illustration of the shoaling test. The numbers indicate the size of the tank (cm). (B) Average interfish distance. (C) Average nearest neighbor distance. (D) Shoal area. (E) Frequency of excursion from the shoal. (F) Shoal polarization. The fish were analyzed in groups (each group included 5 individuals), and 15 groups were analyzed for each of the fish lines. The error bars represent standard error (n = 15). *, p < 0.05; ***, p < 0.001.
Acknowledgments
This image is the copyrighted work of the attributed author or publisher, and
ZFIN has permission only to display this image to its users.
Additional permissions should be obtained from the applicable author or publisher of the image.
Full text @ Int. J. Mol. Sci.

