
- Title
-
Hydroxytyrosol Promotes the Mitochondrial Function through Activating Mitophagy
- Authors
- Dong, Y., Yu, M., Wu, Y., Xia, T., Wang, L., Song, K., Zhang, C., Lu, K., Rahimnejad, S.
- Source
- Full text @ Antioxidants (Basel)
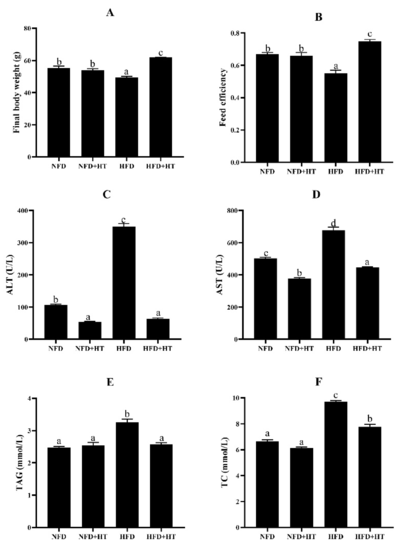
Figure 1. Final body weight (A), feed efficiency (B), plasma aspartate aminotransferase activity (AST: (C)), alanine aminotransferase activity (ALT: (D)), plasma triacylglycerol level (TAG: (E)), and total cholesterol (TC: (F)) content in spotted seabass (L. maculatus) fed the test diets for 8 weeks. All values are exhibited as mean � SE. The values with different superscripts (a, b, c, d) are significantly different at p < 0.05 (Tukey?s test). Feed efficiency = wet weight gain/dry feed fed.
|
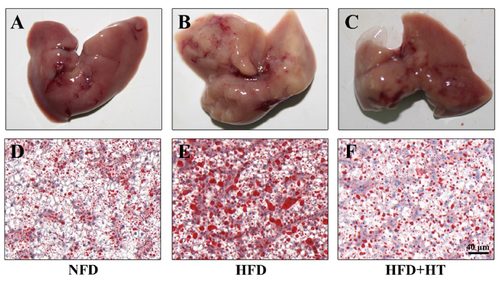
Figure 2. Histological examination of liver in spotted seabass (L. maculatus) fed the test diets for 8 weeks. Representative photographs (A?C) and oil red O-stained sections (D?F, scale bar = 20 ?m).
|
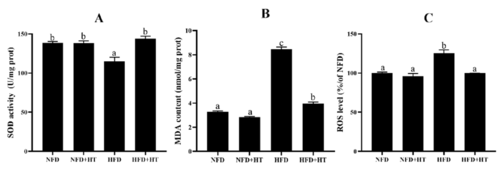
Figure 3. Superoxide dismutase activity (SOD: (A)), malondialdehyde content (MDA: (B)) and reactive oxygen species content (ROS: (C)) in the liver of L. maculatus fed the test diets for 8 weeks. All values are exhibited as mean � SE. The values with different superscripts (a, b, c) are significantly different at p < 0.05 (Tukey?s test).
|
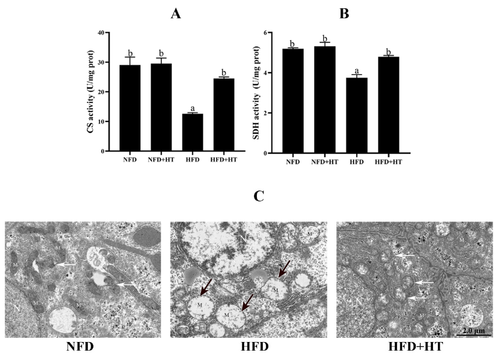
Figure 4. Citrate synthase (CS: (A)) and succinate dehydrogenase (SDH: (B)) activities and (C) transmission electron microscopy images of mitochondria (N?nucleus; M?mitochondrion; black arrows?damaged mitochondria; white arrows?mitochondrial autophagosomes) in the liver of L. maculatus fed the test diets for 8 weeks. All values are exhibited as mean � SE. The values with different superscripts (a, b) are significantly different at p < 0.05 (Tukey?s test).
|
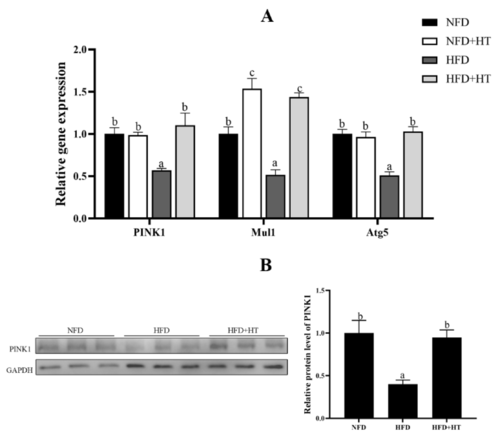
Figure 5. Relative gene expression of mitophagy-related genes (A) and protein level of PINK1 (B) in the liver of L. maculatus fed the test diets for 8 weeks. All values are exhibited as mean � SE. The values with different superscripts (a, b, c) are significantly different at p < 0.05 (Tukey?s test).
|
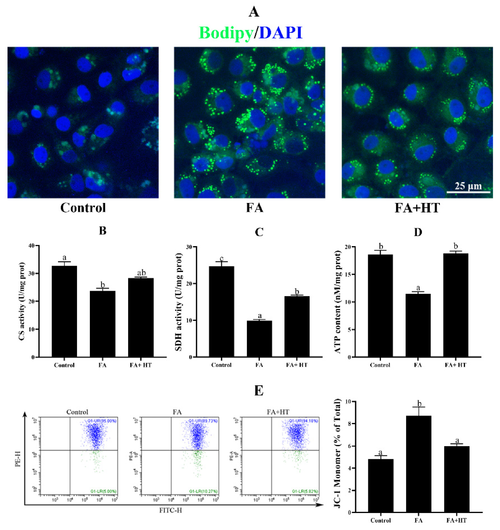
Figure 6. Staining of fat droplet by BODIPY 493/503 (green) in ZFL cell (A). Nuclei are highlighted with Hoechst 33342 (blue), scale bar = 25 ?m. Citrate synthase (CS: (B)) and succinate dehydrogenase (SDH: (C)) activities and ATP content (ATP: (D)) in ZFL cell. Mitochondrial membrane potential (MMP) of ZFL cell was detected by the flow cytometer assessment of JC-1 staining (E). The ratio of JC-1 monomer is shown. Control group?complete LDF medium; FA group?FA medium (complete LDF medium with 0.25 mM oleic acid and 0.25 mM palmitic acid); FA + HT group?FA medium containing 50 ?M of HT. All values are exhibited as mean � SE. The values with different superscripts (a, b, c) are significantly different at p < 0.05 (Tukey?s test).
|
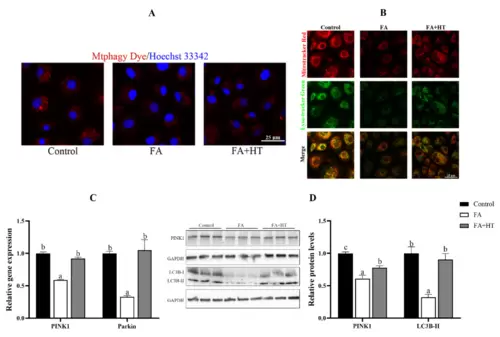
Figure 7. Staining of mitochondrial autophagosomes by Mtphagy Dye (red) in ZFL cell (A). Nuclei are highlighted with Hoechst 33342 (blue). The co-localization of Mitochondrion (Red) and Lysosome (Green) in ZFL cell (yellow dots), (B). Scale bar = 25 ?m. The relative gene expression level of PINK1 and Parkin (C). The relative level of PINK1 and LC3B-II proteins in ZFL cells (D). All values are exhibited as mean � SE. The values with different superscripts (a, b, c) are significantly different at p < 0.05 (Tukey?s test).
|
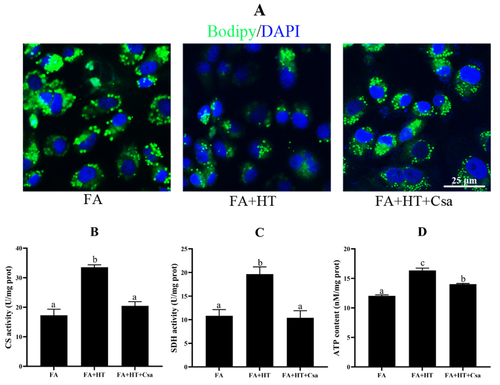
Figure 8. Staining of fat droplet by BODIPY 493/503 (green) in ZFL cell (A). Nuclei are highlighted with Hoechst 33342 (blue), scale bar = 25 ?m (A). Citrate synthase (B) and succinate dehydrogenase (CS: (C)) activities and ATP content (SDH: (D)) in ZFL cell. Values are shown as mean � SE (n = 3). FA group?FA medium; FA + HT group?FA medium containing 50 ?M HT; FA + HT + Csa group?FA medium containing 50 ?M HT with Csa pretreatment. All values are exhibited as mean � SE. The values with different superscripts (a, b, c) are significantly different at p < 0.05 (Tukey?s test).
|
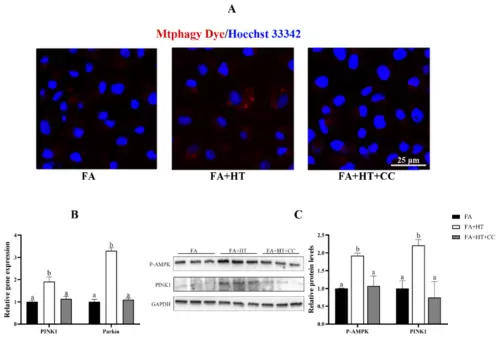
Figure 9. Staining of mitochondrial autophagosomes by Mtphagy Dye (red) in ZFL cell (A). Nuclei are highlighted with Hoechst 33342 (blue), scale bar = 25 ?m (A). The relative gene expression level of PINK1 and Parkin (B). Western blot analysis of PINK1 and P-AMPK in ZFL cell (C). FA group?FA medium (complete LDF medium with 0.25 mM oleic acid and 0.25 mM palmitic acid); FA + HT group?FA medium containing 50 ?M HT, FA + HT + Csa group?FA medium containing 50 ?M HT with CC pretreatment. All values are exhibited as mean � SE. The values of bar graphs with different superscripts (a, b) are significantly different at p < 0.05 (Tukey?s test).
|
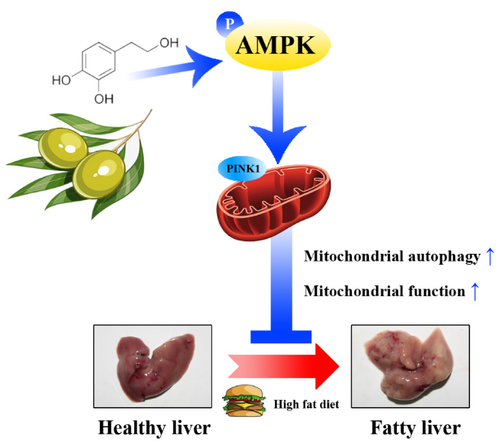
Figure 10. A schematic diagram showing the main internal mechanism of the lipid-lowing effect of HT. HT activates mitochondrial autophagy through the AMPK/PINK1 pathway, promotes mitochondrial function, which alleviates hepatic fat accumulation. |