FIGURE
Fig. 7
Fig. 7
|
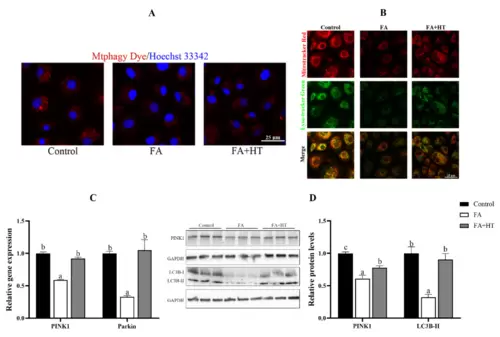
Figure 7. Staining of mitochondrial autophagosomes by Mtphagy Dye (red) in ZFL cell (A). Nuclei are highlighted with Hoechst 33342 (blue). The co-localization of Mitochondrion (Red) and Lysosome (Green) in ZFL cell (yellow dots), (B). Scale bar = 25 ?m. The relative gene expression level of PINK1 and Parkin (C). The relative level of PINK1 and LC3B-II proteins in ZFL cells (D). All values are exhibited as mean ± SE. The values with different superscripts (a, b, c) are significantly different at p < 0.05 (Tukey?s test).
|
Expression Data
Expression Detail
Antibody Labeling
Phenotype Data
Phenotype Detail
Acknowledgments
This image is the copyrighted work of the attributed author or publisher, and
ZFIN has permission only to display this image to its users.
Additional permissions should be obtained from the applicable author or publisher of the image.
Full text @ Antioxidants (Basel)

