
FIGURE
Fig. 1
Fig. 1
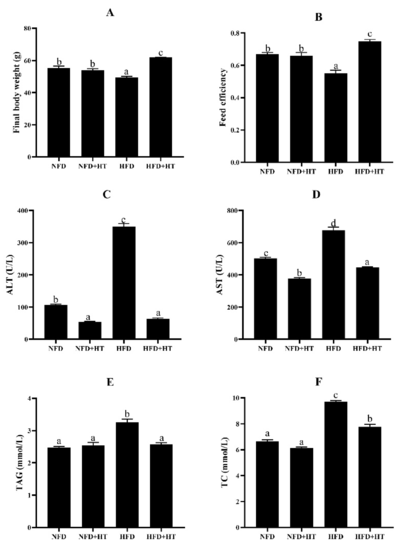
Figure 1. Final body weight (A), feed efficiency (B), plasma aspartate aminotransferase activity (AST: (C)), alanine aminotransferase activity (ALT: (D)), plasma triacylglycerol level (TAG: (E)), and total cholesterol (TC: (F)) content in spotted seabass (L. maculatus) fed the test diets for 8 weeks. All values are exhibited as mean � SE. The values with different superscripts (a, b, c, d) are significantly different at p < 0.05 (Tukey?s test). Feed efficiency = wet weight gain/dry feed fed.
|
Expression Data
Expression Detail
Antibody Labeling
Phenotype Data
Phenotype Detail
Acknowledgments
This image is the copyrighted work of the attributed author or publisher, and
ZFIN has permission only to display this image to its users.
Additional permissions should be obtained from the applicable author or publisher of the image.
Full text @ Antioxidants (Basel)