Image
Figure Caption
Fig. 9
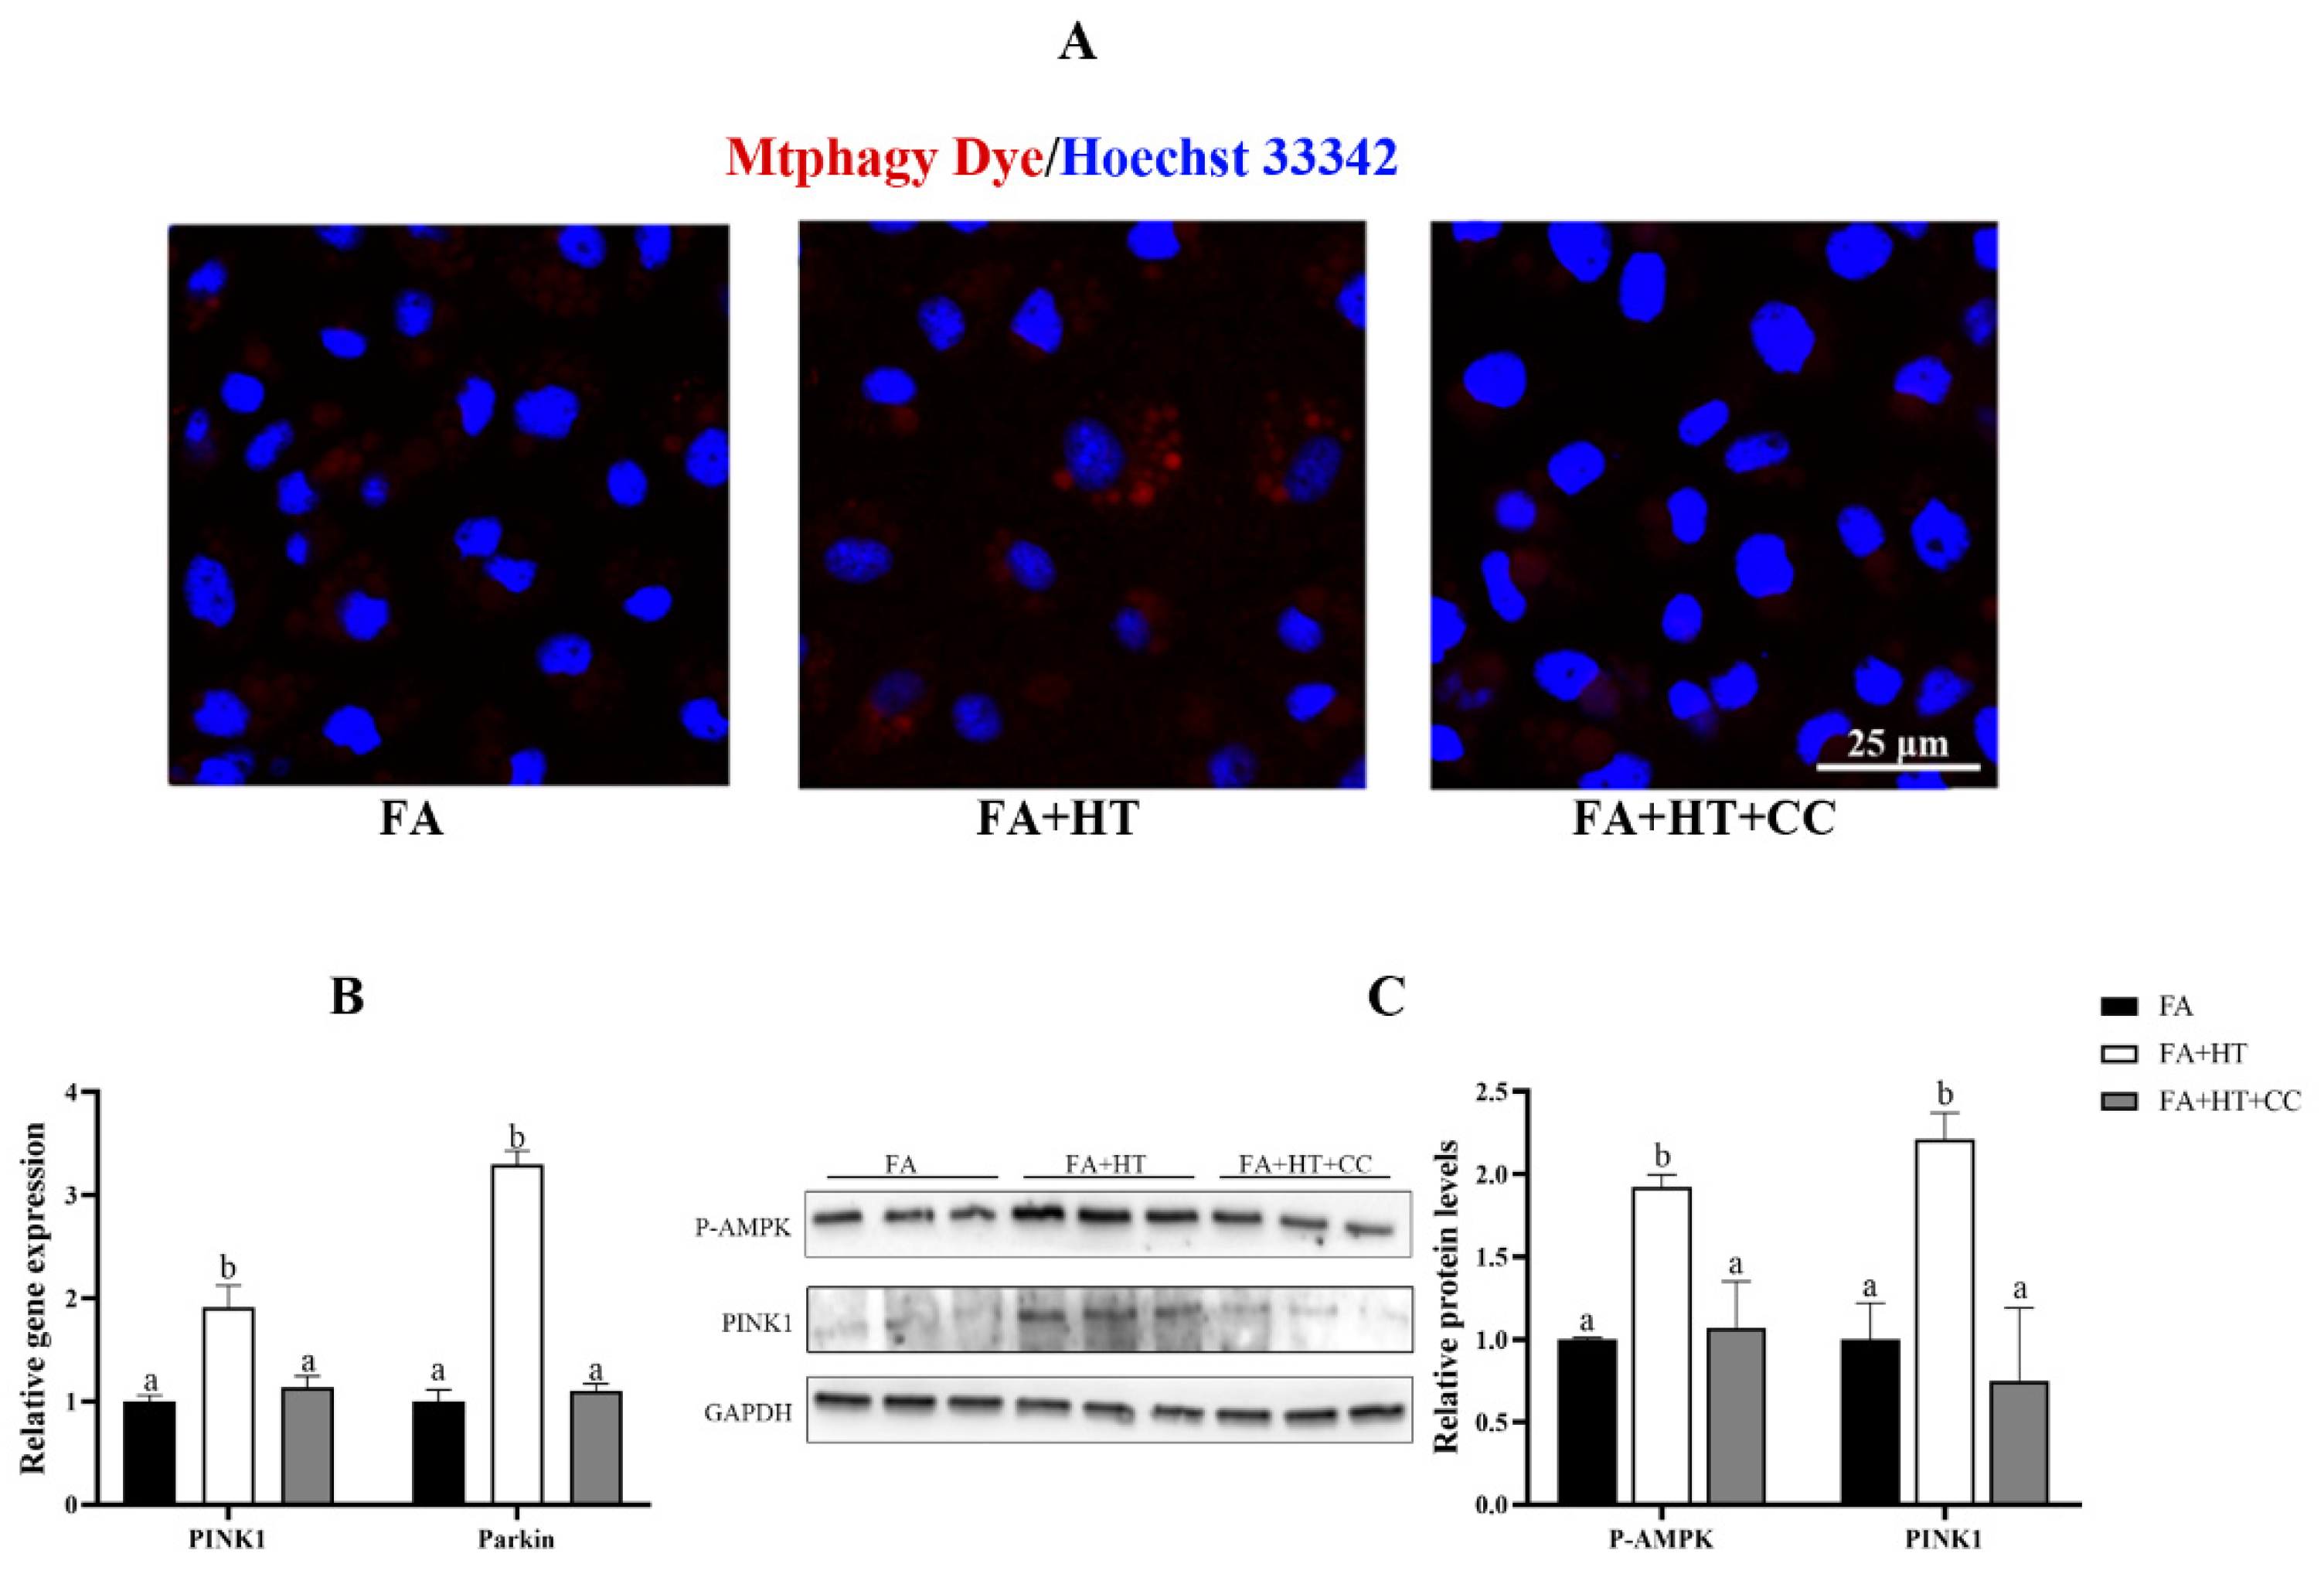
Figure 9. Staining of mitochondrial autophagosomes by Mtphagy Dye (red) in ZFL cell (A). Nuclei are highlighted with Hoechst 33342 (blue), scale bar = 25 ?m (A). The relative gene expression level of PINK1 and Parkin (B). Western blot analysis of PINK1 and P-AMPK in ZFL cell (C). FA group?FA medium (complete LDF medium with 0.25 mM oleic acid and 0.25 mM palmitic acid); FA + HT group?FA medium containing 50 ?M HT, FA + HT + Csa group?FA medium containing 50 ?M HT with CC pretreatment. All values are exhibited as mean ± SE. The values of bar graphs with different superscripts (a, b) are significantly different at p < 0.05 (Tukey?s test).
Acknowledgments
This image is the copyrighted work of the attributed author or publisher, and
ZFIN has permission only to display this image to its users.
Additional permissions should be obtained from the applicable author or publisher of the image.
Full text @ Antioxidants (Basel)

