Image
Figure Caption
Fig. 6
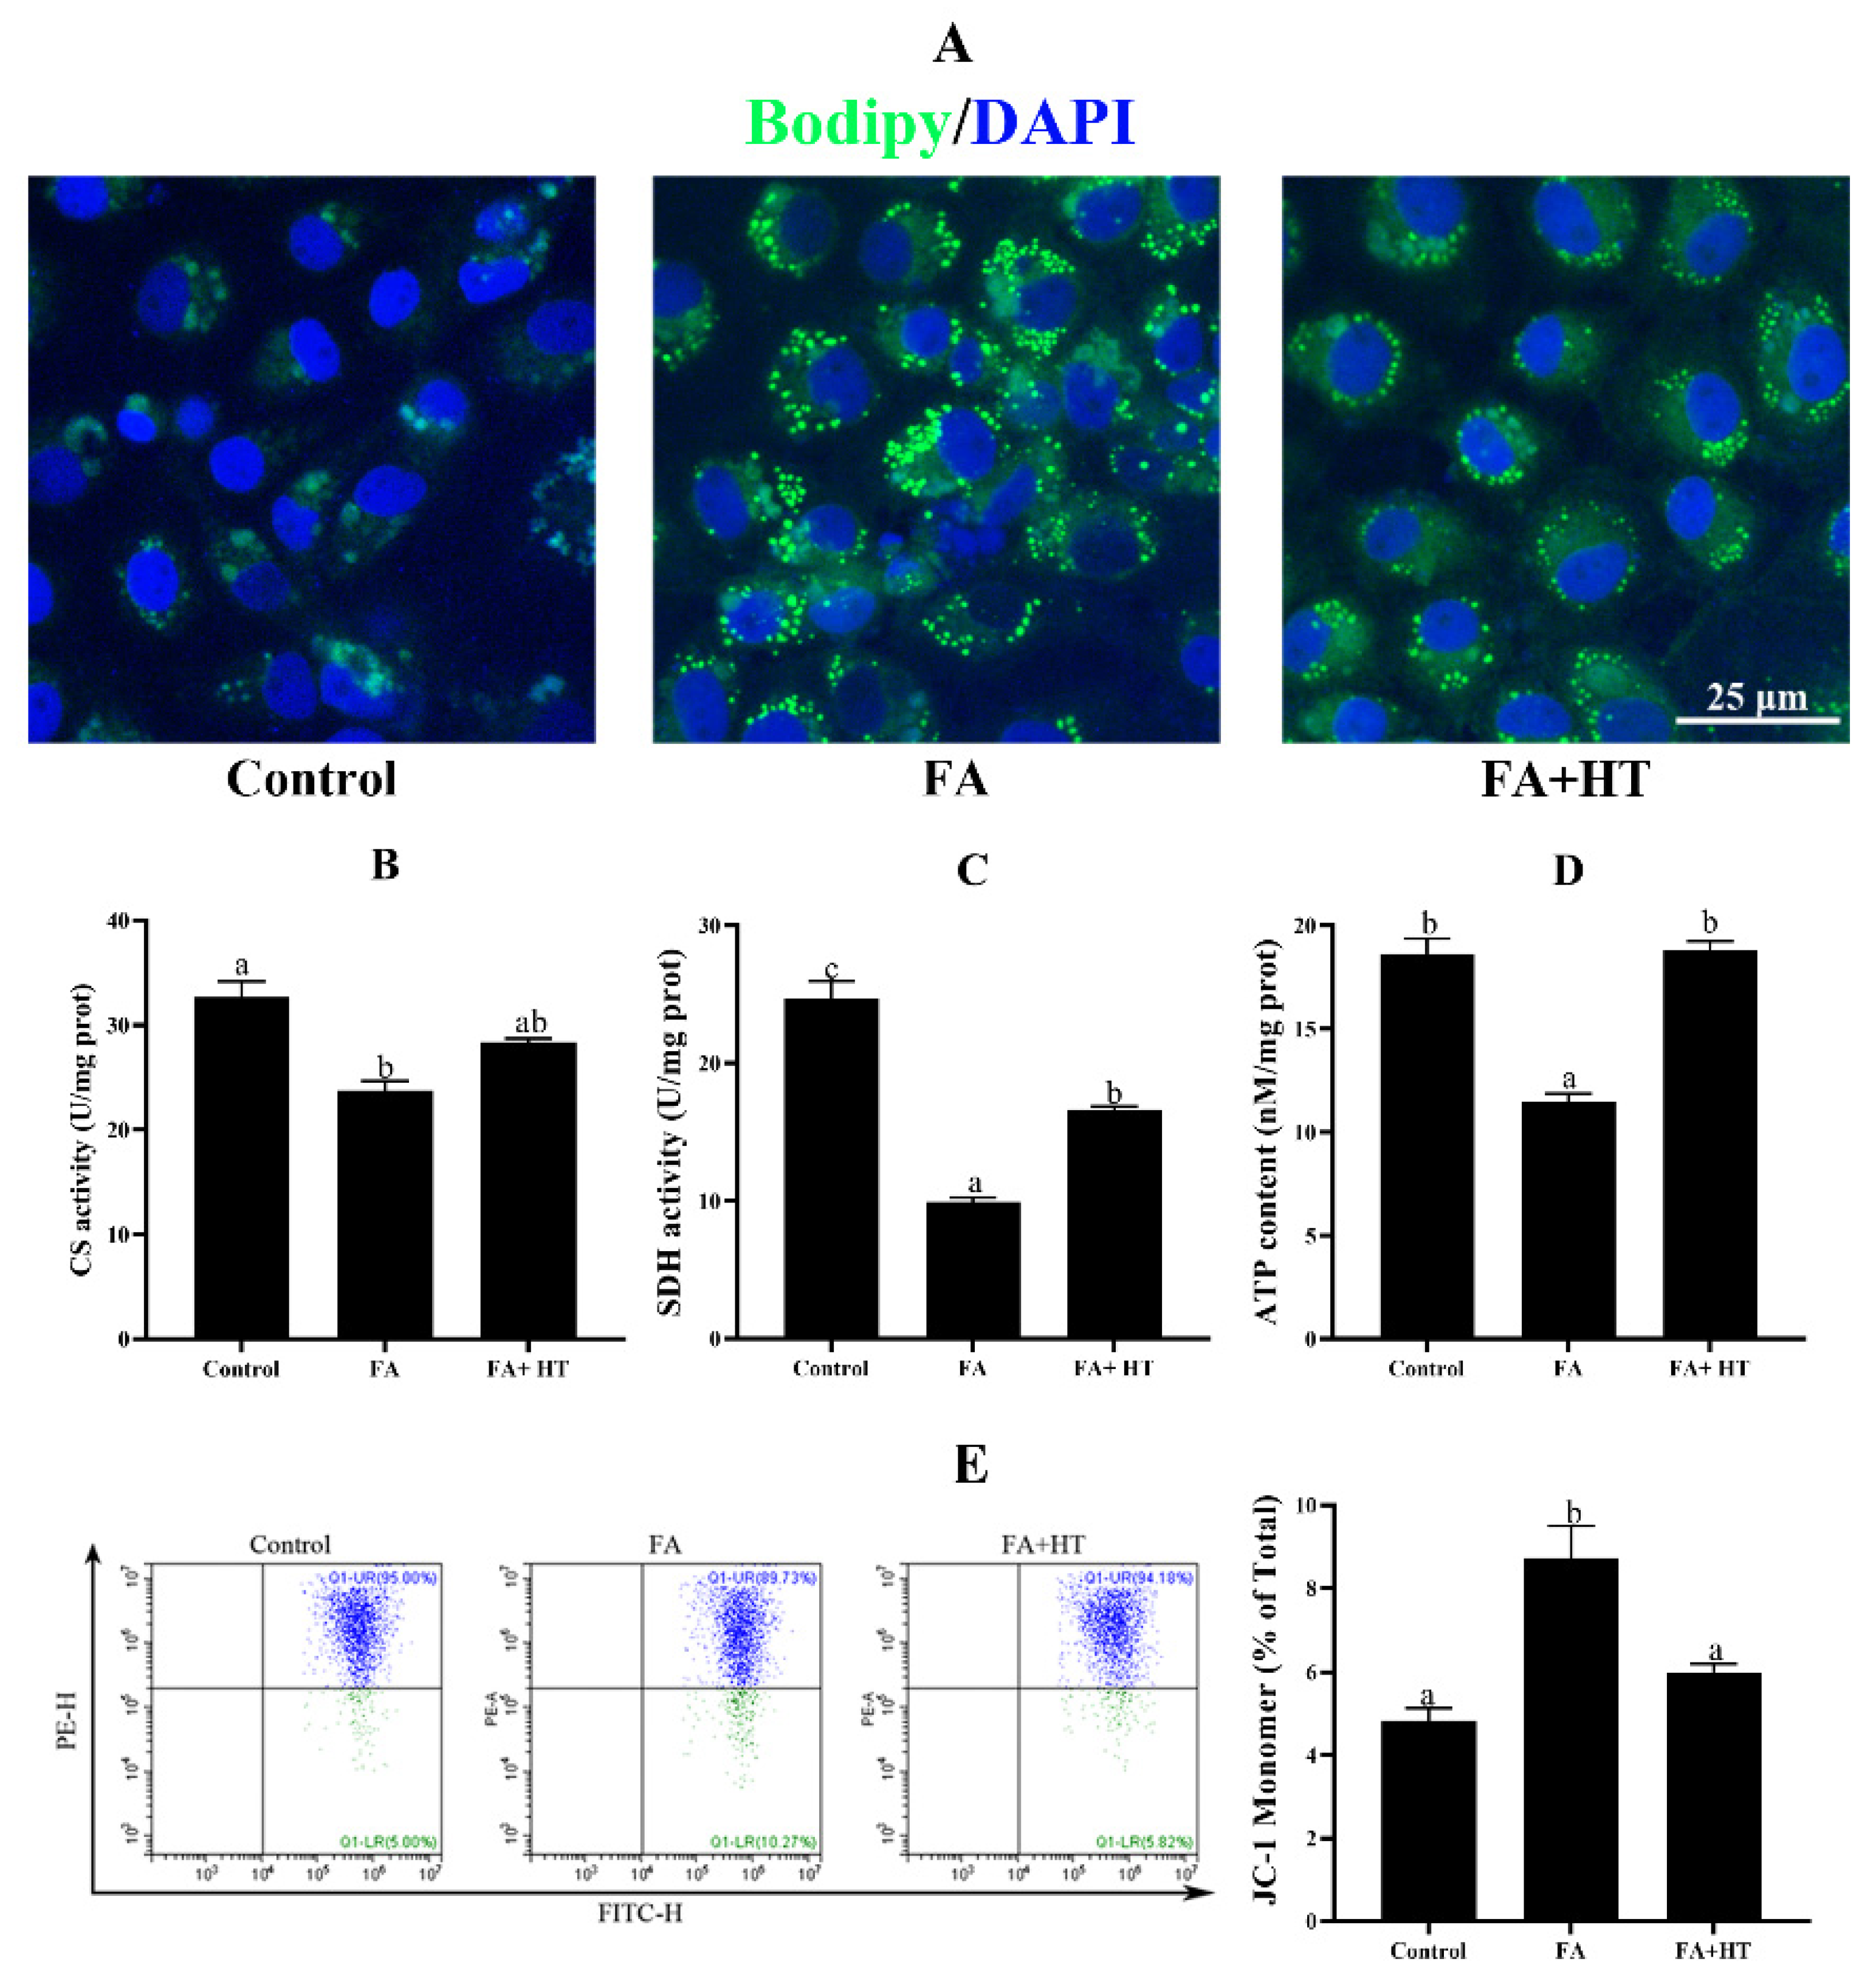
Figure 6. Staining of fat droplet by BODIPY 493/503 (green) in ZFL cell (A). Nuclei are highlighted with Hoechst 33342 (blue), scale bar = 25 ?m. Citrate synthase (CS: (B)) and succinate dehydrogenase (SDH: (C)) activities and ATP content (ATP: (D)) in ZFL cell. Mitochondrial membrane potential (MMP) of ZFL cell was detected by the flow cytometer assessment of JC-1 staining (E). The ratio of JC-1 monomer is shown. Control group?complete LDF medium; FA group?FA medium (complete LDF medium with 0.25 mM oleic acid and 0.25 mM palmitic acid); FA + HT group?FA medium containing 50 ?M of HT. All values are exhibited as mean ± SE. The values with different superscripts (a, b, c) are significantly different at p < 0.05 (Tukey?s test).
Acknowledgments
This image is the copyrighted work of the attributed author or publisher, and
ZFIN has permission only to display this image to its users.
Additional permissions should be obtained from the applicable author or publisher of the image.
Full text @ Antioxidants (Basel)

