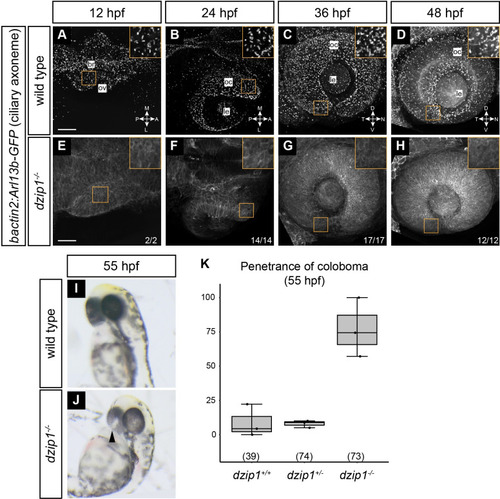
<italic toggle='yes'>dzip1</italic> mutants have no cilia in the eye and display coloboma.

(A-H) Wild type (A-D) and dzip1ts294e mutants (E-H) visualized for cilia (Tg(bactin2:Arl13b-GFP)) at 12 hpf (A, E), 24 hpf (B, F), 36 hpf (C, G), and 48 hpf (D, H). A, B, E, and F are dorsal views of 3-dimensional renderings; while C, D, G, and H are lateral views of 3-dimensional renderings. (A-D) GFP-positive cilia are visualized as distinct puncta present throughout the lens, eye, and embryo midline (A, magenta arrowhead). (E-H) Cilia are completely absent in dzip1-- embryos. n (fraction of dzip1-/- embryos showing complete absence of cilia) is shown at the bottom right of each panel. Insets show zoomed views for each timepoint and genotype. (I-K) dzip1-/- mutants display coloboma. (I) Wildtype embryo at ~55 hpf; the eye is evenly pigmented; there is no coloboma. (J) dzip1ts294e mutant embryo, ~55 hpf; coloboma is visible as a hypopigmented region at the back of the eye (arrowhead). (K) Penetrance of the coloboma phenotype at 55 hpf. n (embryos) for each genotype shown at the base of the graph. Scale bar: 50 μm. M, medial; L, lateral; A, anterior; P, posterior; D, dorsal; V, ventral; N, nasal; T, temporal; le, lens; oc, optic cup.

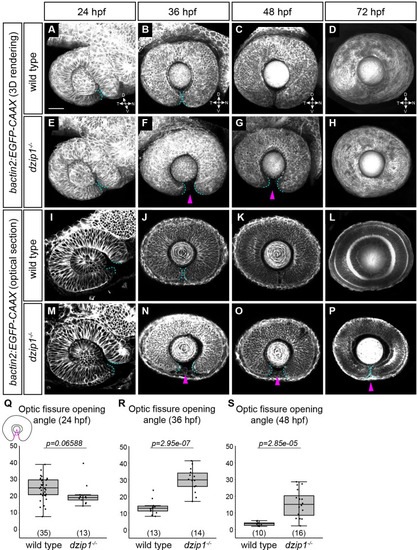
<italic toggle='yes'>dzip1</italic> mutants show defects in optic fissure closure but not optic fissure formation.

(A-P) Wild type (A-D, I-L) and dzip1ts294e mutants (E-H, M-P) visualized for membranes (Tg(bactin2:EGFP-CAAX)) at 24 hpf (A, E, I, M), 36 hpf (B, F, J, N), 48 hpf (C, G, K, O), and 72 hpf (D, H, L, P). (A-H) Images are lateral views of 3-dimensional renderings. (I-P) Images are lateral views, optical sections from 3-dimensional datasets at the proximal-distal midpoint of the lens. Cyan dashed lines in A-P outline optic fissure margins. At 36 hpf and 48 hpf, dzip1-/- embryos display wider optic fissure openings (F, G, N, O, magenta arrowheads). At 72 hpf, all mutants (9/9) still have an open fissure (P, magenta arrowhead), while 2/15 siblings have an open fissure. (Q-S) Quantification of optic fissure opening angle at 24 hpf, 36 hpf, and 48 hpf. n (embryos) for each genotype shown at the base of the graph. P-values were calculated using Welch’s t-test (Q-S). Scale bar: 50 μm. D, dorsal; V, ventral; N, nasal; T, temporal.

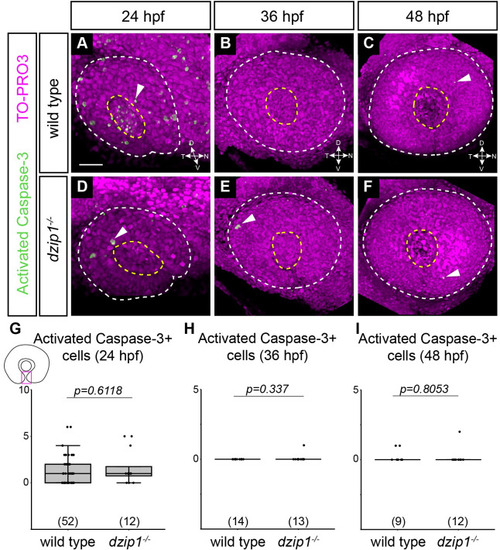
Apoptotic cell death in the optic fissure is not aberrantly upregulated in the <italic toggle='yes'>dzip1</italic> mutant.

(A-F) Whole mount immunofluorescence in wild type (A-C) and dzip1ts294e mutants (D-F) for cell death (green; activated Caspase-3) and nuclei (magenta; TO-PRO-3) at 24 hpf (A, D), 36 hpf (B, E), and 48 hpf (C, F). All images are lateral views of 3-dimensional renderings. White dashed lines mark the boundary of the eye; yellow dashed lines mark the lens. Examples of cells labeled with activated caspase-3 elsewhere within the eye are indicated (white arrowheads). (G-I) Quantification of total number of activated caspase-3-positive cells within the optic fissure in the eye at 24 hpf, 36 hpf, and 48 hpf. n (embryos) for each genotype shown at the base of the graph. P-values were calculated using Welch’s t-test (M-O). Scale bar: 50 μm. D, dorsal; V, ventral; N, nasal; T, temporal.

EXPRESSION / LABELING:
Antibody:
Fish:
Anatomical Terms:
Stage Range: Prim-5 to Long-pec
PHENOTYPE:
Fish:
Observed In:
Stage Range: Prim-5 to Long-pec

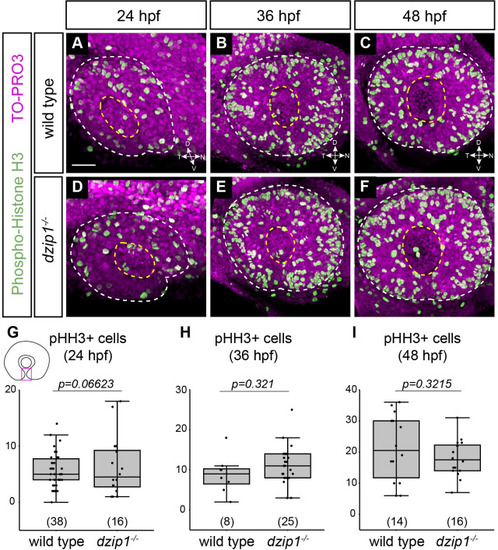
Cell proliferation in the optic fissure is not altered in the <italic toggle='yes'>dzip1</italic> mutant.

(A-F) Whole mount immunofluorescence in wild type (A-C) and dzip1ts294e mutants (D-F) for cell death (green; phospho-histone H3) and nuclei (magenta; TO-PRO-3) at 24 hpf (A, D), 36 hpf (B, E), and 48 hpf (C, F). All images are lateral views of 3-dimensional renderings. White dashed lines mark the boundary of the eye; yellow dashed lines mark the lens. (G-I) Quantification of total number of phospho-histone H3-positive cells within the optic fissure in the eye at 24 hpf, 36 hpf, and 48 hpf. n (embryos) for each genotype shown at the base of the graph. P-values were calculated using Welch’s t-test (M-O). Scale bar: 50 μm. D, dorsal; V, ventral; N, nasal; T, temporal.

EXPRESSION / LABELING:
Antibody:
Fish:
Anatomical Terms:
Stage Range: Prim-5 to Long-pec
PHENOTYPE:
Fish:
Observed In:
Stage Range: Prim-5 to Long-pec

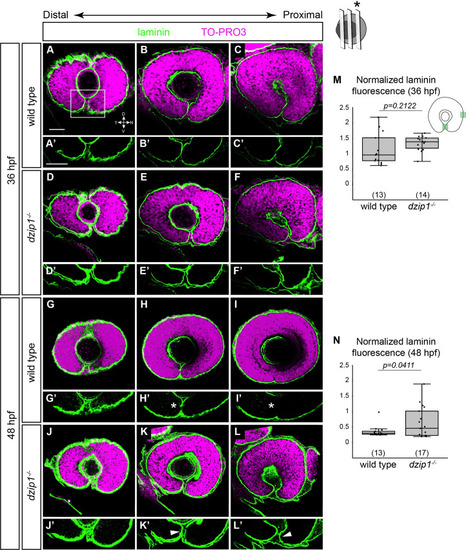
The optic fissure basement membrane fails to breakdown in <italic toggle='yes'>dzip1</italic> mutants.

(A-L) Whole mount immunofluorescence for Laminin (green), and nuclei (magenta, TO-PRO-3) in wild type (A-C, G-I) and dzip1ts294e mutants (D-F, J-L) at 36 hpf (A-F), and 48 hpf (G-L). All images are lateral views. Single optical sections were obtained from three different depths along the proximal-distal axis of the eye (see Methods for details). (A’-L’) Insets of the optic fissure, the laminin channel alone (green) for wild type (A’-C’, G’-I’), and dzip1ts294e mutants (D’-F’, J’-L’), at 36 hpf (A’-F’) and 48 hpf (G’-I’). At 36 hpf, laminin protein completely lines the fissure in both genotypes. At 48 hpf, laminin protein is lost in the optic fissure in wild type embryos (H’, I’, white asterisks), whereas laminin continues to persist in the optic fissure in dzip1-/- embryos (K’, L’, white arrowheads). (M, N) Quantification of laminin fluorescence intensity in the optic fissure in the proximal optical section at 36 hpf and 48 hpf. Laminin fluorescence intensity at the optic fissure was normalized to the laminin fluorescence intensity at the nasal boundary of the eye next to the olfactory placode. n (embryos) for each genotype shown at the base of the graph. P-values were calculated using Welch’s t-test (M-O). Scale bar: 50 μm. D, dorsal; V, ventral; N, nasal; T, temporal.

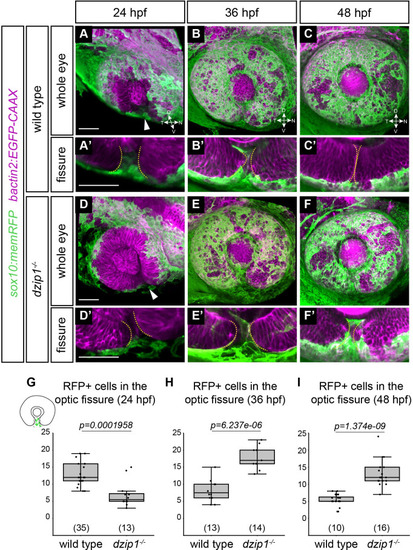
<italic toggle='yes'>Tg(sox10</italic>:<italic toggle='yes'>memRFP)-</italic>positive neural crest cells do not properly localize in the optic fissure in <italic toggle='yes'>dzip1</italic> mutants.

Embryos visualized for neural crest (green; Tg(sox10:memRFP)) and cell membranes (magenta; Tg(bactin2:EGFP-CAAX)) in wild type (A-C) and dzip1ts294e mutants (D-F) at 24 hpf (A, D), 36 hpf (B, E), and 48 hpf (C, F). (A’-F’) Zoomed views of images in A-F to facilitate visualization of neural crest cells within the optic fissure. All images are lateral views of 3-dimensional renderings. Some Tg(sox10:memRFP)-positive neural crest cells are detectable in the optic fissure by 24 hpf in both wild type and dzip1-/- embryos (white arrowheads in A, D). (G-I) Quantification of total number of Tg(sox10:memRFP)-positive cells through the length of the optic fissure within the eye at 24, 36, and 48 hpf. n (embryos) for each genotype shown at the base of the graph. P-values were calculated using Welch’s t-test (M-O). Scale bar: 50 μm. D, dorsal; V, ventral; N, nasal; T, temporal.

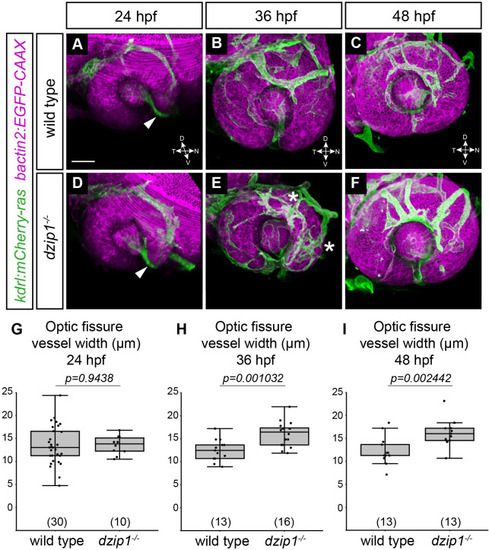
<italic toggle='yes'>dzip1</italic> mutants exhibit defective accumulation of POM-derived endothelial cells.

(A-F) Embryos visualized for endothelial cells (green; Tg(kdrl:ras-mCherry)) and cell membranes (magenta; Tg(bactin2:EGFP-CAAX)) in wild type (A-C) and dzip1ts294e mutants (D-F) at 24 hpf (A, D), 36 hpf (B, E), and 48 hpf (C, F). All images are lateral views of 3-dimensional renderings. mCherry-positive endothelial cells populate the optic fissure by 24 hpf in both wild type and dzip1-/- embryos (A, D; white arrowheads). (E) asterisks, ectopic branching of the superficial network in dzip1 mutant. (G-I) Quantification of fissure vessel width (in μm) at 24 hpf, 36 hpf, and 48 hpf. n (embryos) for each genotype shown at the base of the graph. P-values were calculated using Welch’s t-test (M-O). Scale bar: 50 μm. D, dorsal; V, ventral; N, nasal; T, temporal.

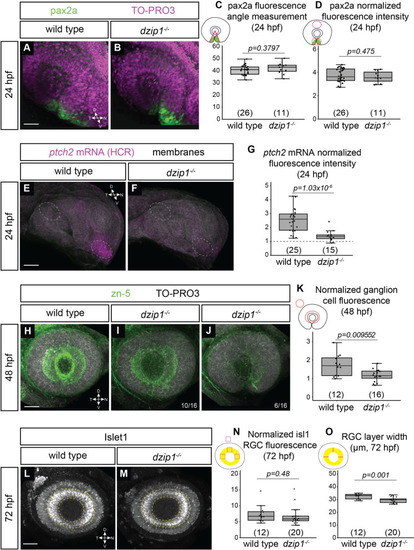
<italic toggle='yes'>dzip1</italic> mutants show defects in ganglion cell differentiation, which may be indicative of disrupted Hedgehog (Hh) signaling.

(A-B) Whole mount immunofluorescence for pax2a (green), and nuclei (magenta, TO-PRO-3) in wild type (A) and dzip1ts294e mutants (B) at 24hpf. Images are lateral views of 3-dimensional renderings. (C) Quantification of the pax2a+ domain, and (D) Quantification of pax2a normalized fluorescence intensity at 24 hpf. Quantification was carried out as depicted in the schematics; for fluorescence quantification, measurements in the optic stalk and fissure were normalized to a region in the dorsal optic cup. (E-F) ptch2 mRNA expression (HCR, magenta) and membranes (gray) in wild type (E) and dzip1ts294e mutants (F) at 24 hpf. Images are maximum intensity projections of ptch2 mRNA channel (magenta) on an average projection of the membrane channel (gray) to visualize tissue morphology; embryos were oriented laterally. (G) Quantification of ptch2 mRNA fluorescence intensity. Fluorescence in the optic stalk region was normalized to a region in the dorsal optic cup (as depicted by dashed ellipses in E and F). (H-J) Whole mount immunofluorescence for retinal ganglion cells (green, zn-5) and nuclei (magenta, TO-PRO-3) in wild type (H) and different dzip1ts294e mutants (I, J) at 48 hpf. All images are lateral views of 3-dimensional renderings. Two classes of dzip1-/- phenotype were noted (I, J); fraction of dzip1-/- embryos showing each type of zn-5 labeling is shown at the bottom right of each panel. (K) Quantification of zn-5 fluorescence intensity at 48 hpf. Fluorescence intensity was measured in an elliptical ROI on a maximum intensity projection of the three-dimensional z-stack spanning the depth of the lens. Zn-5 fluorescence intensity in the eye was normalized to a region in the brain dorsal to the eye. (L-M) Whole mount immunofluorescence for islet1/2 (gray) in wild type (L) and dzip1ts294e mutants (M) at 72 hpf. Images are maximum intensity projections of laterally oriented embryos. Islet1 is expressed by retinal ganglion cells (layer marked by yellow dashed lines) and subsets of amacrine, bipolar, and horizontal cells. (N-O) Quantification of islet1/2 staining in RGCs, specifically for fluorescence intensity (N) and RGC layer width (O). Quantification method is depicted in each schematic. For islet1/2 RGC fluorescence, mean gray value was measured at nasal, dorsal, and temporal positions within the RGC layer, and the average of those values was normalized to the mean gray value at a position dorsal to (outside of) the eye. The width of the RGC layer was calculated by measuring the width of the RGC layer at nasal, dorsal, and temporal positions; these measurements were averaged for each embryo. For all graphs, n (embryos) for each genotype shown at the base of the graph. P-values were calculated using a student’s t-test (M-O). Scale bar: 50 μm. D, dorsal; V, ventral; N, nasal; T, temporal.

Acknowledgments
This image is the copyrighted work of the attributed author or publisher, and ZFIN has permission only to display this image to its users. Additional permissions should be obtained from the applicable author or publisher of the image. Full text @ PLoS One