- Title
-
Wnt/β-catenin signaling promotes neurogenesis in the diencephalospinal dopaminergic system of embryonic zebrafish
- Authors
- Westphal, M., Panza, P., Kastenhuber, E., Wehrle, J., Driever, W.
- Source
- Full text @ Sci. Rep.
|
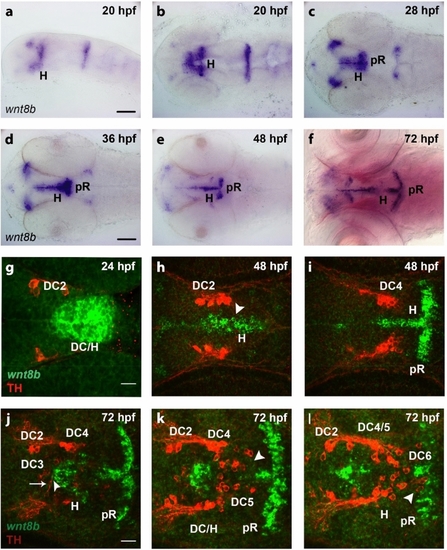
Expression of wnt8b in the ventral diencephalon and hypothalamus and in relation to dopaminergic neurons. (a?f) Expression of wnt8b in embryos as detected by whole mount in situ hybridization at stages as indicated. Lateral (a) and dorsal (b?f) views of heads of embryos, images generated from Z-projections of image stacks. Scale bars in (a) and (d) are 100 Ám for (a?f). (g?l) Expression of wnt8b detected by fluorescent in situ hybridization (green) in relation to TH-immunoreactive DA neurons detected by immunofluorescence (red) in embryos at stages as indicated. Dorsal views of the ventral diencephalon/hypothalamus region. Confocal image stacks were recorded and images show single optical sections of Z-stacks containing TH-immunoreactive cells. DA neuron groups DC2 and DC4 of the ventral diencephalon and DC5 and DC6 of the hypothalamus are labeled. (h,i). Two optical sections of a single 48 hpf embryo at 13.97 Ám distance from dorsal (h) to ventral (i). (j?l) Three optical section of a single 72 hpf embryo at (j?k) 13.97 Ám and (k?l) 5.08 Ám distances, with the dorsalmost section shown in (j). Scale bar in (g) is 20 Ám for (g?l). (g?l) Z-stacks are included as video files in Supplementary Information as Supplementary Video 1 (g), Supplementary Video 2 (h?i), and Supplementary Video 3 (j?l). Scale bar in (g) is 20 Ám for (g?i) and scale bar in (j) is 20 Ám for (j?l). DC diencephalon, H hypothalamus, pR posterior recess. |
|
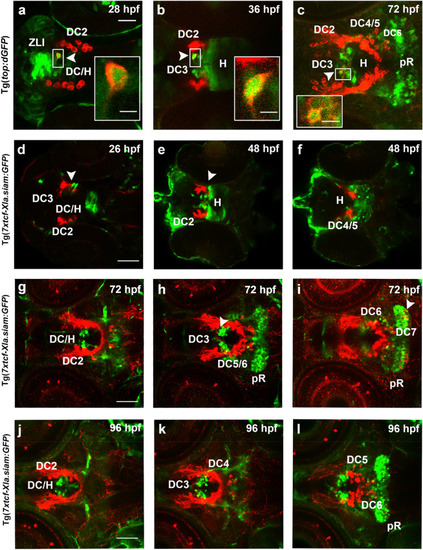
Activity domains of Wnt/?-catenin signaling in relation to TH-immunoreactive cells in the ventral diencephalon and hypothalamus. (a?l) Wnt/?-catenin-reporter Tg(top:dGFP) (a?c) and Tg(7xtcf-Xla.siam:GFP) (d?l) zebrafish embryos were stained by double immunofluorescence for TH-immunoreactive cells (red) and GFP-immunoreactive cells (green) at indicated stages. Dorsal views of the ventral diencephalon/hypothalamus region. Confocal image stacks were recorded and images show 1.2 Ám single optical sections of Z-stacks containing TH-immunoreactive cells. DA neuron groups DC2 and DC4 of the ventral diencephalon, DC3 of the medial hypothalamus and DC5 and DC6 of the hypothalamus are labeled. (e,f) Two optical sections of a single 48 hpf embryos at 33.02 Ám distance from dorsal (e) to ventral (f). (g?i) Three optical section of single 72 hpf embryo at (g?i) 16.51 Ám and (i,j) 11.43 Ám distances, with the dorsalmost section shown in (g). (j?l) Three optical section of a single 96 hpf embryo at (j?k) 11.43 Ám and (k?l) 13.47 Ám distances, with the dorsalmost section shown in (j). (d?l) Z-stacks are included in Supplementary Information as Supplementary Video 4 (g), Supplementary Video 5 (e,f), Supplementary Video 6 (g?i) and Supplementary Video 7 (j?l). Inserts in (a?c) show higher magnifications of boxed areas in (a?c). Scale bar in (a) is 20 Ám for (a?c) and in (d,g,j) is 50 Ám for (d?l) Scale bars in inserts are 5 Ám for (a?c). DC diencephalon, H hypothalamus, pR posterior recess, ZLI Zona limitans intrathalamica. |
|
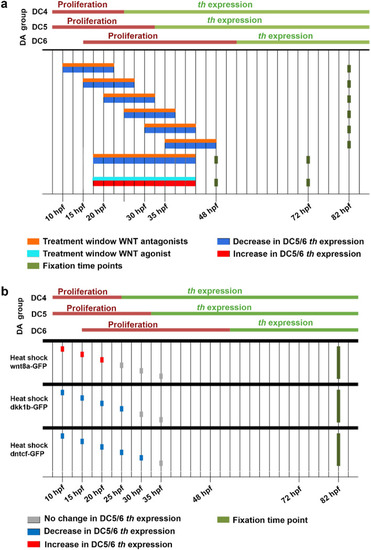
Summary of effects of inhibition and activation of Wnt/?-catenin signaling on hypothalamic DC5/6 DA neuron development. (a) Experimental design and summary of the results of pharmacological inhibition and activation of canonical Wnt signaling. The graph summarizes the findings from Figs. 4 and ?and55 and Supplementary Figs. 2 and 3. Top half of bars shows treatment time, bottom half color code for effect on DA neurons. Small molecule antagonists IWR-1 or XAV939 were applied for overlapping 12 h time windows (orange bars). The small molecule antagonist IWR-1 and the agonist BIO were also each applied from 18 to 42 hpf (orange and cyan bars). Small molecule and control treated embryos were fixed at 48 hpf for Wnt target gene axin2 expression analysis and either at 72 hpf or 80 hpf for th expression analysis (dark green dots). Color code indicates whether the treatment caused a decrease (blue) or an increase (red) in th expression as analyzed in embryos at either 72 or 80 hpf. The upper part indicates the temporal correlation of treatment windows and results of pharmacological manipulations to cell cycle exit and differentiation of DC4 and most of DC5 and DC6 DA neurons25. (b) Experimental design and summary of the results of heat-shock induced overexpression of Wnt8a, Dkk1b and a dominant negativeTcf3 (dnTcf3). The graph summarizes the findings from Figs. 6 and ?and7.7. Single heat shock treatments were performed at indicated time points (dots). Heat shocked heterozygous transgenic embryos and WT siblings were fixed as indicated (green dots) for th expression analysis. Color code indicates whether the treatment caused no change (grey), decrease (blue) or an increase (red) in th expression. The upper part indicates the temporal correlation to DA development as in (a). |
|
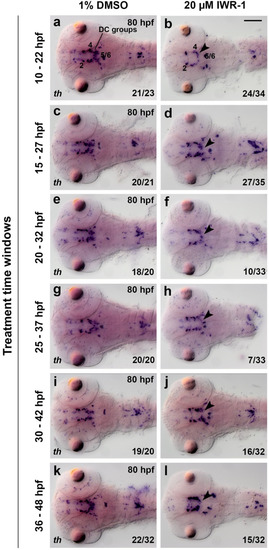
Inhibition of Wnt/?-catenin signaling by IWR-1 affects DA neurons in the ventral diencephalon and hypothalamus. (a?l) Expression analysis of the DA neuron marker th by whole mount in situ hybridization in embryos treated with IWR-1 (right) or DMSO (control, left) during time windows indicated on the left side of each row, and subsequently fixed at 80 hpf. The th expressing DC groups 2?6 are indicated in (a) and (b). The arrowhead in (b,d,f,h,j,l) point at decreased th expression in DC5/6 groups. Dorsal views of heads of larvae, images are Z-projections of image stacks. Scale bar in (b) is 100 Ám for all images. Numbers N/N in bottom right corner of each image indicate number of representative phenotypes as shown in image versus total embryos analyzed for this condition. |
|
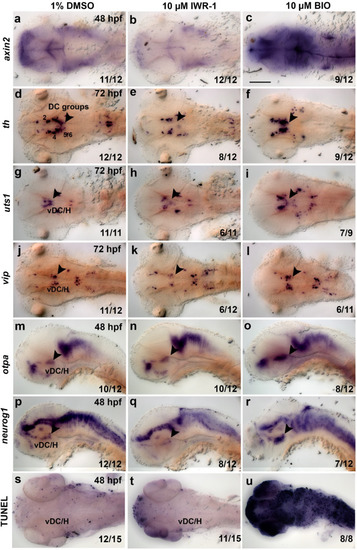
Pharmacological inhibition and activation of Wnt/?-catenin signaling affect neurogenesis of hypothalamic neurons. (a?r) Expression analysis of axin2 (a?c), th (d?f), uts1 (g?i), vip (j?l), otpa (m?o) and neurog1 (p?r) by whole mount in situ hybridization and detection of cell death by the TUNEL assay (s?u) in embryos treated with DMSO (control), IWR-1 or BIO as indicated at top. All embryos were treated from 18 to 42 hpf and fixed at stages indicated in left column of image panels. (a?l) Dorsal and (m?r) lateral views of larval heads, images are Z-projections of image stacks. The arrowheads point to differences in marker gene expression within the ventral diencephalon and hypothalamus. Scale bar in (c) is 100 Ám for all images. Numbers N/N in bottom right corner of each image indicate number of representative phenotypes as shown in image versus total embryos analyzed for this condition. H hypothalamus, vDC ventral diencephalon. |
|
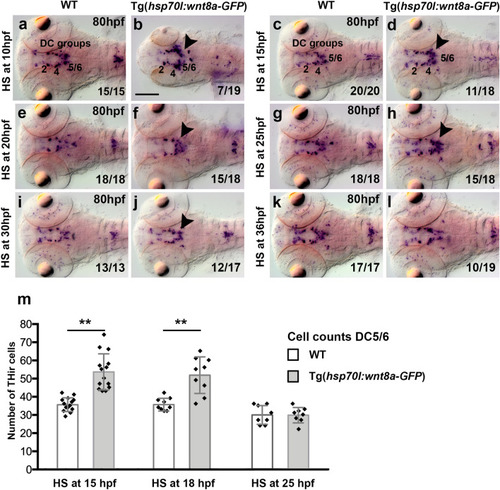
Heat shock induced Wnt8a overexpression affects hypothalamic DC5 and DC6 DA neurons in a stage dependent manner. (a?l) Expression of DA neuron marker th as detected by WISH in WT (a,c,e,g,i,k) and in heterozygous transgenic Tg(hsp70l:wnt8a-GFP) siblings (b,d,f,h,j,l) subjected to heat-shock treatments as indicated on the left and subsequently fixed at 80 hpf. Dorsal views, images are Z-projections of image stacks. The th expressing DC groups 2, 4, 5 and 6 are indicated in (a), (b), (c) and (d). The arrowheads in (d), (f), (h) and (j) point to an increase in th expression in DC5 and DC6 DA neuron groups. Scale bar in (b) is 100 Ám for all images. Numbers N/N in bottom right corner of each image indicate number of representative phenotypes as shown in image versus total embryos analyzed for this condition. (m) A separate experiment was performed for quantification of TH-immunoreactive cells in WT embryos compared to heterozygous transgenic Tg(hsp70l:wnt8a-GFP) siblings heat shocked as indicated and fixed at 82 hpf. Bar charts show cell count numbers and the mean of TH-immunoreactive cells for each indicated DA neuron groups. Error bars depict standard deviations of the mean. Asterisks indicate significant differences compared to non-transgenic sibling control (**p = 0.001 for 15 hpf and p = 0.0009 for 18 hpf; Mann?Whitney U test; n = 14 for 15 hpf, n = 9 for 18 hpf and n = 8 for 25 hpf. Software: Prism 6.0f. from GraphPad Software Inc.). |
|
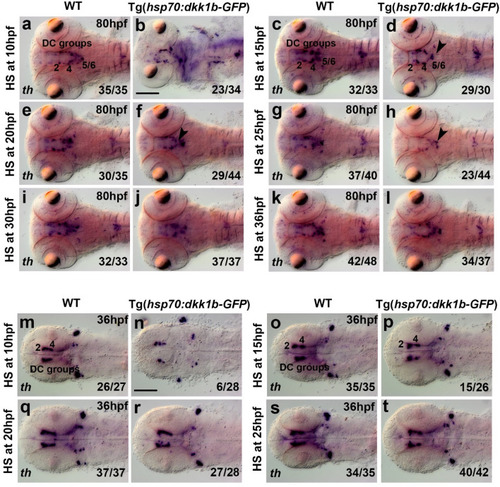
Heat shock induced Dkk1b overexpression affects hypothalamic DC5 and DC6 DA neurons in a stage dependent manner. (a?s) Expression of DA neuron marker th as detected by WISH in WT embryos and heterozygous transgenic Tg(hsp70l:dkk1b-GFP) siblings after heat-shock treatment as indicated on the left side of each pair of images, and subsequently fixed at 80 hpf (a?l) or 36 hpf (m?t). Dorsal views, images are Z-projections of image stacks. The arrowheads in (d), (f) and (h) point at a decrease in th expression in DC5 and DC6 DA neuron groups. Scale bars in (b) for (a?l) and in (n) for (m?t) are 100 Ám. Numbers N/N in bottom right corner of each image indicate number of representative phenotypes as shown in image versus total embryos analyzed for this condition. |
|
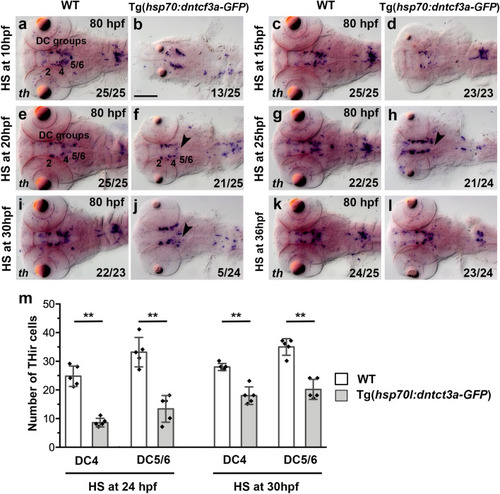
Heat-shock induced ?Tcf3 overexpression causes reduction in ventral diencephalic DC4 and hypothalamic DC5 and DC6 DA neurons. (a?l) Expression of DA neuron marker th as detected by WISH in WT embryos and in heterozygous transgenic Tg(hsp70l:?tcf3a-gfp) [here designated Tg(hsp70l:dntcf3-GFP)] siblings after heat-shock treatment as indicated on the left side of each pair of images, and subsequently fixed at 80 hpf. Dorsal views, images are Z-projections of image stacks. The th expressing DC groups 2?6 are indicated. The arrowheads point to a decrease in th expression in DC5 and DC6 DA neuron groups. Scale bar in (b) is 100 Ám for all images. Numbers N/N in bottom right corner of each image indicate number of representative phenotypes as shown in image versus total embryos analyzed for this condition. (m) Quantification of TH-immunoreactive cells in WT embryos compared to heterozygous transgenic Tg(hsp70l:dntcf3-GFP) siblings heat shocked as indicated fixed at 82 hpf. Bar charts show cell count numbers and the mean of TH-immunoreactive cells for each indicated DA neuron groups. Error bars depict standard deviations of the mean. Asterisks indicate significant differences compared with the non-transgenic sibling control (**p = 0.0079; Mann?Whitney U test; n = 5 in each condition. Software: Prism 6.0f. from GraphPad Software Inc.). |

