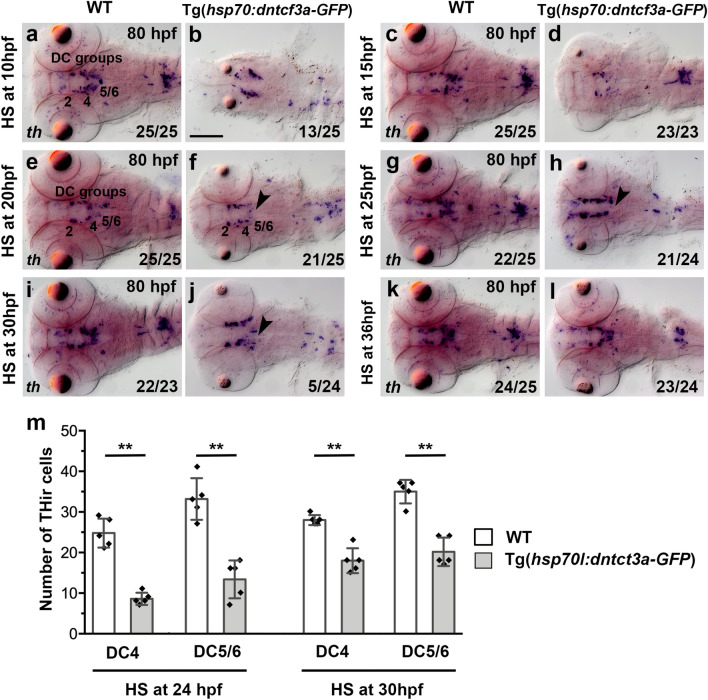
Figure 8
Heat-shock induced ΔTcf3 overexpression causes reduction in ventral diencephalic DC4 and hypothalamic DC5 and DC6 DA neurons. (a–l) Expression of DA neuron marker th as detected by WISH in WT embryos and in heterozygous transgenic Tg(hsp70l:Δtcf3a-gfp) [here designated Tg(hsp70l:dntcf3-GFP)] siblings after heat-shock treatment as indicated on the left side of each pair of images, and subsequently fixed at 80 hpf. Dorsal views, images are Z-projections of image stacks. The th expressing DC groups 2–6 are indicated. The arrowheads point to a decrease in th expression in DC5 and DC6 DA neuron groups. Scale bar in (b) is 100 µm for all images. Numbers N/N in bottom right corner of each image indicate number of representative phenotypes as shown in image versus total embryos analyzed for this condition. (m) Quantification of TH-immunoreactive cells in WT embryos compared to heterozygous transgenic Tg(hsp70l:dntcf3-GFP) siblings heat shocked as indicated fixed at 82 hpf. Bar charts show cell count numbers and the mean of TH-immunoreactive cells for each indicated DA neuron groups. Error bars depict standard deviations of the mean. Asterisks indicate significant differences compared with the non-transgenic sibling control (**p = 0.0079; Mann–Whitney U test; n = 5 in each condition. Software: Prism 6.0f. from GraphPad Software Inc.).

