- Title
-
Chromatin remodeller CHD7 is required for GABAergic neuron development by promoting PAQR3 expression
- Authors
- Jamadagni, P., Breuer, M., Schmeisser, K., Cardinal, T., Kassa, B., Parker, J.A., Pilon, N., Samarut, E., Patten, S.A.
- Source
- Full text @ EMBO Rep.
|
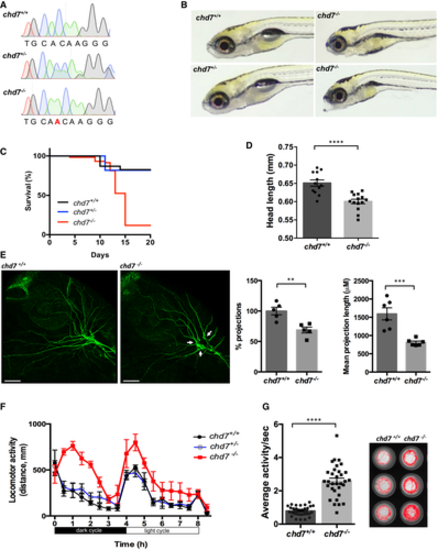
Chromatograms showing the confirmation a 1-nucleotide insertion mutation by Sanger sequencing. Gross morphological analyses of control (chd7+/+; top left image), heterozygous (chd7+/?; bottom left image) and knockout mutants (chd7?/?; images in right panel). Kaplan?Meier survival plot showing low survival of chd7 mutants after 12 dpf (N = 5). Measurement of head size of control (n = 12) and mutants (n = 14) showing significantly smaller head size in chd7?/? fish (****P < 0.0001, Student?s t-test). Acetylated tubulin staining in 28 hpf controls (left) and mutants (right) showing severely affected outbranching of the trigeminal nerve (Vth cranial nerve). Notably, chd7?/? display reduced branching of the Vth cranial nerve (arrows) and axonal arborization in the tectal area. Graphs showing quantitative analyses of percentage (n = 5) and mean total length of peripheral projections (n = 6) per zebrafish in controls and mutants (***P < 0.001; **P < 0.005, Student?s t-test). Locomotor activity of control (black), heterozygous (blue) and mutants (red) showing significant hyperactivity of mutants in dark and light cycles (N = 3, n = 48). Average activity per second during dark cycle (left) is significantly increased in chd7?/? mutants compared with chd7+/+ (n = 32; ****P < 0.0001, Student?s t-test). Representative swimming tracks during dark cycle of control and mutant fish (right). Mutant chd7?/? larvae displayed hyperactive swimming. Data information: ****P < 0.0001; ***P < 0.001; **P < 0.005, Student?s t-test. Data are presented as mean ▒ SEM. Scale bar = 50 ?m. n represents number of fish. N represents number of experimental repeats. |
|
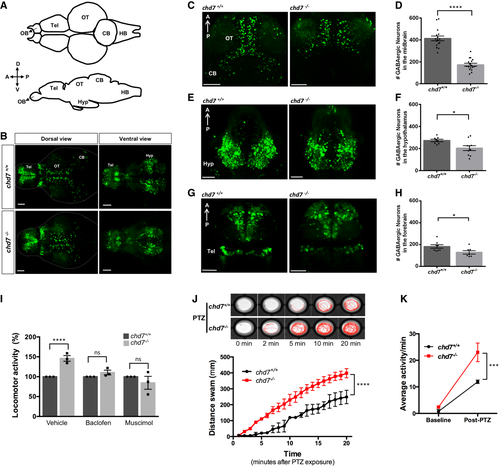
A. Structural illustration of 5 dpf zebrafish brain from dorsal (top) and lateral (bottom) view (OB: Olfactory bulb, Tel: Telencephalon, OT: Optic tectum, CB: Cerebellum, HB: Hindbrain). B. 5 dpf dlx5a/6a transgenic line showing GFP+ GABAergic neurons are reduced in chd7?/? mutants (bottom) in comparison with controls (top) in both dorsal (left) and ventral (right) view. C?H. Total number of GABAergic neurons (GFP+ cells) in (C, D) the optic tectum (OT) and cerebellum (CB) regions of 5 dpf wild-type and chd7 mutant fish (n = 16; ****P < 0.0001; Student?s unpaired t-test), (E, F) the hypothalamus (hyp) region (n = 10; *P = 0.0182; Student?s t-test) and (G, H) the telencephalon (tel) (n = 7; *P = 0.0347; Student?s t-test). I. Treatment of control (dark grey) and mutants (light grey) with GABA agonists Baclofen (N = 3, n = 24; ns, P = 0.1427; Student?s t-test) and Muscimol (N = 3, n = 24; ns, P = 0.3987; Student?s t-test) showing recovery of hyperactive locomotor activity in chd7?/? mutants (vehicle: N = 3, n = 24, ****P < 0.0001; Student?s t-test). J. Functional analysis of GABAergic signalling shows increased responsiveness to GABA antagonist PTZ in both onset and overall locomotor activity (n = 24; ****P < 0.0001; one-way ANOVA). K. Average locomotor activity between 2 dpf controls (black) and chd7?/? mutants (red) shows increased activity after 3 mM PTZ exposure (n = 24; ***P < 0.001; two-way ANOVA). Data information: Data are presented as mean ▒ SEM. Scale bar = 50 ?m. n represents number of fish used. N represents number of experimental repeats. |
|
Transcriptomic analysis was performed on dissected 5 dpf brains. A. Volcano plot showing each gene plotted according to its log2 fold change. All highly differentially expressed genes with P < 0.05 are in orange with fold change > 1.5. B, C. Biological processes (B) and molecular function (C) that are enriched in the differentially expressed genes. D. ERK activation by phosphorylation is increased in mutants as shown by Western blot quantification (N = 4; ***P < 0.005; Student?s t-test). E. pERK immunohistochemistry showing increased ERK activation in the mutant brain (N = 3, n = 8). F, G. Treatment with the ERK signalling inhibitor U0126 ameliorated the number of GABAergic neuron (n = 10?15; **P < 0.05; ****P < 0.0001, one-way ANOVA). H. Treatment with the ERK signalling inhibitor U0126 rescues locomotor hyperactivity phenotype in chd7 mutant fish (n = 8 for chd7+/+ and chd7?/?; n = 16 for U0126-treated fish; ****P < 0.0001; ns, not significant, one-way ANOVA). Data information: Data are presented as mean ▒ SEM. Scale bar = 50 ?m. n represents number of fish used. N represents number of experimental repeats. |
|
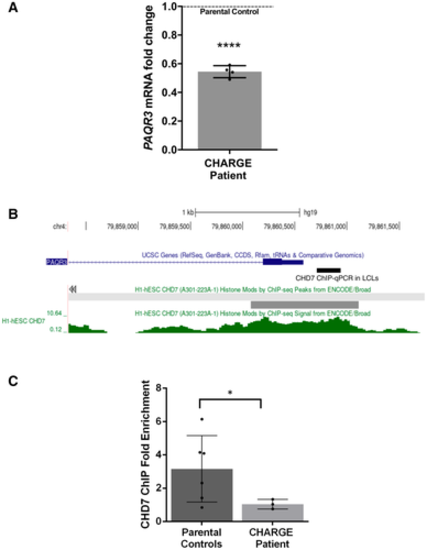
qPCR analysis of PAQR3 expression in a CHD7 mutation-positive patient compared with parental controls set (N = 4; ****P < 0.0001; Student?s t-test). Fold change was calculated according to the 2 - ? ? C t method, using HPRT1 and RPS1 as housekeeping genes for normalization. All data were expressed as mean fold change ▒ SD across replicates, relative to control parents set to 1 (dotted line). N is the number of experimental repeats. Schematic view of PAQR3 exon 1 and proximal promoter on chromosome 4 (hg19 assembly), obtained with the UCSC genome browser (https://genome.ucsc.edu/) and showing the sequence amplified in ChIP-qPCR assays in LCLs (thick black line) along with a previously described CHD7 ChIP-seq peak (thick grey line) and signal (green) in H1-hESC (ENCODE3). ChIP-qPCR assays in LCLs showing decreased occupation of CHD7 on the PAQR3 proximal promoter in a CHD7 mutation-positive patient (N = 3) compared with parental controls (N = 6); *P < 0.05; Student?s t-test. All data were expressed as mean fold change ▒ SD. N is the number of experimental repeats. |
|
A, B. GABAergic neuron defects in wild-type fish treated with ER/Golgi traffic inhibitor BFA (n = 9; ****P < 0.0001; ns, not significant; one-way ANOVA). C, D. Overexpression of paqr3b mRNA improve the number of GABAergic neurons in 3dpf chd7 mutant fish (n = 7 for chd7?/? and n = 11 for chd7?/? + paqr3b mRNA; ****P < 0.0001; **P < 0.05; One-way ANOVA). Of note, the rescue experiment was performed at 3 dpf given the transient nature of mRNA. E. ERK activation by phosphorylation in chd7?/? mutants was restored to normal levels upon overexpression of paqr3b mRNA shown by Western blot quantification (N = 4; **P < 0.05; One-way ANOVA, N is the number of experimental repeats). Data information: Data are presented as mean ▒ SEM. Scale bar = 50 ?m. |
|
A. Movement scores of chd-7(gk290) mutants (red) compared with N2 wildtype (WT; black). Two-tailed t-test was performed for statistical analyses, and movement score was considered different to WT (N = 3, n = 30; ****P < 0.0001, Student?s t-test). B. Lifespan analyses of chd-7(gk290) mutants (n = 339; red) compared with WT (n = 444; black). Log-rank test was performed for statistical analyses. ***P < 0.001. C. WT and chd-7(gk290) animals with defects in the GABAergic (black) and cholinergic nervous system (grey) at the L4 stage (N = 4, n = 100; ****P < 0.0001; Student?s t-test). D?F. Example pictures of the GABAergic nervous system cell bodies, commissures, axonal gaps and axonal breaks larger than 50 Ám per worm in chd-7(gk290) mutants expressing unc-47p::mCherry. G?I. GABAergic neurodevelopmental defects of WT (black) and chd-7(gk290) mutants (grey) at the L4 stage classified in axonal gaps per worm (G), number of GABAergic cell bodies (H) and number of commissures (I). N = 4, n = 100; ****P < 0.0001, Student?s t-test. J. Chemical libraries (3,850 compounds) were first screen in chd-7(gk290) C. elegans mutants and positive hits were tested on chd7 zebrafish mutants. K. 49 compounds that improved motility phenotypes in chd-7(gk290) mutants were identified. These compounds were clustered in 6 main functional categories. L. Movement scores of chd-7(gk290) mutants treated with ephedrine (blue) compared with the solvent DMSO (black). N = 3, n > 100; ****P < 0.0001, Student?s t-test. M. Defects of the GABAergic nervous system at the L4 stage in chd-7(gk290) mutants treated with ephedrine (grey) compared with DMSO (black) (N = 3, n > 100). ****P < 0.0001, Student?s t-test. N. Average activity per second is wild-type and mutants treated with ephedrine compared with non-treated mutant (wild-type treated with ephedrine is referred to as Control). Ephedrine suppresses hyperactivity in chd7 mutant fish. n = 24; ****P < 0.0001, one-way ANOVA. O. Representative images of GABAergic neurons and total number of GABAergic neurons (GFP+ cells) in the optic tectum (OT) and cerebellum (CB) regions of wild-type, chd7 mutant and ephedrine-treated fish (n = 9; ****P < 0.0001; One-way ANOVA). Treatment with ephedrine ameliorated the number of GABAergic neurons. P, Q. pERK is reduced in mutants following treatment with ephedrine as shown by Western blot quantification (N = 4). ****P < 0.0001, one-way ANOVA. R. qPCR analysis of paqr3b expression in chd7+/+, chd7?/? and chd7?/? treated with ephedrine (N = 4; ****P < 0.0001; ns, not significant, one-way ANOVA). |
|
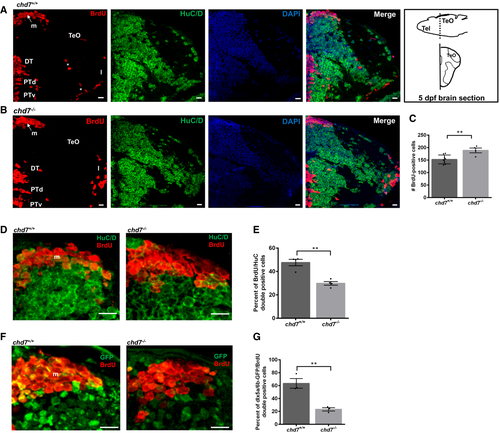
A, B. Immunostaining with BrdU and HuC/D in brain sections of the zebrafish tectal region in chd7+/+ (A) and chd7?/? (B). Level of the sections is indicated in the sketch of a 5 dpf zebrafish brain (top right image in (A)). The scale bar is 10 ?m. Tel: Telencephalon; TeO: tectum opticum, m: medial tectal proliferating zone, DT: dorsal thalamus, PTd: dorsal part of posterior tuberculum, PTv: ventral part of posterior tuberculum, l: lateral tectal proliferation zone. Asterisks (*) marks early migrated region of pretectum and proglomerular. C. The number of BrdU-positive cells in transverse sections of the zebrafish brain in chd7+/+ and chd7?/? (N = 3, chd7+/+: n = 8; chd7?/?: n = 4; **P < 0.05; Student?s t-test). D. Immunostaining with BrdU and HuC/D in brain sections of the zebrafish medial tectal region. Scale bar = 10 ?m. m: medial tectal. E. The percentage of BrdU and HuC/D-double positive cells among the BrdU-positive cells in the medial tectal zone (N = 3, n = 4; **P < 0.05; Student?s t-test). F. Immunostaining with BrdU and GFP (to label dlx5a/6a-GFP + GABAergic neurons) in brain sections of the zebrafish medial tectal region. Scale bar = 10 ?m. m: medial tectal. G. The percentage of BrdU and dlx5a/6a-GFP-double positive cells among the BrdU-positive cells in the medial tectal zone (N = 3, n = 3; **P < 0.05; Student?s t-test). Data information: Data are presented as mean ▒ SEM. n is the number of fish used. N is the number of experimental repeats. |
|
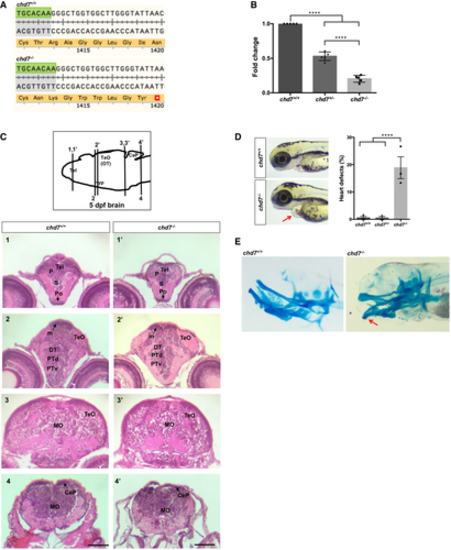
Translation following genome editing resulted in a premature stop codon (*) in chd7?/? fish. qPCR analysis of RNAs from 3dpf larvae shows a significant reduction of chd7 mRNA expression in both chd7+/? and chd7?/? compared with wild-type (N = 5). ****P < 0.0001, one-way ANOVA. Examination of brain tissues in chd7+/+ (left images) and chd7?/? (right images) by H&E staining at 5 dpf. Zebrafish brains were sectioned at telencephalic (1,1?), diencephalic (2, 2?), mesencephalic (3,3?) and rhombencephalic levels (4,4?). Levels of sections are indicated in the sketch of a sagittal view of a 5 dpf zebrafish brain (top image). The scale bar is 0.12 mm. P: pallium, S: subpallium, Po:preoptic region, Tel: Telencephalon; TeO: tectum opticum (or OT: optic tectum), m: medial tectal proliferating zone, DT: dorsal thalamus, PTd: dorsal part of posterior tuberculum, PTv: ventral part of posterior tuberculum, MO: medulla oblongata, Hyp: hypothalamus, CeP: cerebellar plate. chd7?/? mutant fish displayed features of CS such as heart defects (red arrow) at a low penetrance (N = 3). ****P < 0.0001; Student?s t-test. Alcian blue staining of 6dpf larvae showing craniofacial defects at Meckel?s cartilage (red arrow). Data information: Data are presented as mean ▒ SEM. n is the number of fish used. N is the number of experimental repeats. |
|
Analysis of GABAergic neurons network development between 1 dpf and 5 dpf between control (top row) and chd7 mutants (bottom row) (N = 3). Proliferation analysis by pH3 staining at 2 dpf in control and chd7 mutants. Bar graph showing no difference in pH3-positive cells in zebrafish brain at 2 dpf between control and mutants (n = 11; ns, P = 0.1816; Student?s t-test). Cell death analysis by TUNEL assay in chd7?/? and chd7+/+ brains shows no change in apoptotic cells at 2 dpf (N = 3, n = 8; ns, P = 0.464; Student?s t-test). Transverse sections of 2 dpf larvae after immunostaining with pH3 (red) and NeuroD1 (green). Bar graph showing no difference in pH3 and NeuroD1 double-positive cells (arrows) in zebrafish brain at 2 dpf between control and mutants (N = 3, n = 5; ns, P = 0.124; Student?s t-test). P: pallium, S: subpallium, TeO: tectum opticum, m: medial tectal proliferating zone, DT: dorsal thalamus R: retina. Proliferation analysis by pH3 staining at 5 dpf in control and chd7 mutants. An increase in pH3-positive cells was noted in brains of mutant fish compared with controls at 5 dpf (N = 4, n = 10; ****P < 0.0001; Student?s t-test). Transverse sections of 5 dpf larvae after immunostaining with pH3 (red) and HuC/D (green). pH3-positive cells (arrows) were observed at 5 dpf in the medial tectal proliferating zone of mutant fish brains but none in controls (N = 3). P: pallium, S: subpallium, TeO: tectum opticum, m: medial tectal proliferating zone, DT: dorsal thalamus. Data information: Data are presented as mean ▒ SEM. Scale bar = 50 ?m and 10 ?m for 2 dpf NeuroD1 and pH3 co-stain. |
|
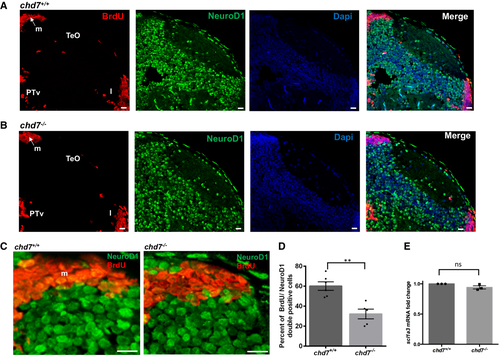
A, B. Immunostaining with BrdU and NeuroD1 in brain sections of the zebrafish tectal region in chd7+/+ (A) and chd7?/? (B). The scale bar is 10 ?m. Tel: Telencephalon; TeO: tectum opticum, m: medial tectal, DT: dorsal thalamus, PTd: dorsal part of posterior tuberculum, PTv: ventral part of posterior tuberculum, l: lateral tectal proliferation zone. C. Immunostaining with BrdU and NeuroD1 in brain sections of the zebrafish medial tectal region. Scale bar = 10 ?m. m: medial tectal. D. The percentage of BrdU and NeuroD1-double positive cells among BrdU-positive cells in the medial tectal zone (N = 3, chd7+/+: n = 6; chd7?/?: n = 6; **P < 0.05; Student?s t-test). E. Expression level of scl1a3 mRNA in chd7?/? relative to chd7+/+ (N = 4). ns, not significant; Student?s t-test. Data information: Data are presented as mean ▒ SEM. n is the number of fish used. N is the number of experimental repeats. |
|
A, B. Expression profile of paqr3b in whole-mount zebrafish by in situ hybridization (A) and in tissues by qRT?PCR (B). N = 4. C. qRT?PCR validation of the downregulation of paqr3b (N = 4; ****P < 0.0001, Student?s t-test). D. Images of gross morphology of 2 dpf zebrafish embryos with or without overexpression of paqr3b mRNA. Of note, neither abnormalities nor death were observed in zebrafish embryos upon overexpression of paqr3b mRNA. Data information: Data are presented as mean ▒ SEM. n is the number of fish used. N is the number of experimental repeats. |
|
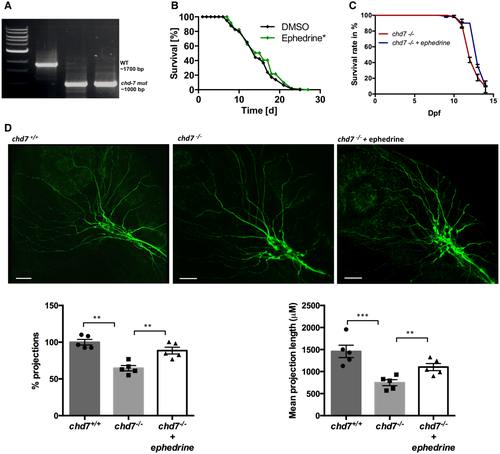
PCR proof of a 700 bp deletion in the chd-7 gene in chd-7(gk290) mutant worms. Lifespan analyses of chd-7(gk290) Caenorhabditis elegans mutants treated with ephedrine (green) compared with control DMSO (black). Log-rank test was performed for statistical analyses. (N = 3, n = 50; *P < 0.05). Survival rate of chd7?/? zebrafish mutants treated with ephedrine (blue) compared with untreated mutants (red). N = 3, n = 60. Acetylated tubulin staining in non-treated and ephedrine-treated chd7?/? zebrafish mutants showing rescue of the severely affected outbranching structure of Vth cranial nerves. Graphs showing quantitative analyses of percentage and mean total length of peripheral projections per zebrafish in controls and mutants without and with ephedrine treatment (n = 5; ***P < 0.001; **P < 0.005; one-way ANOVA). Data information: Data are presented as mean ▒ SEM. Scale bar = 50 ?m. n is the number of fish or worms used. N is the number of experimental repeats. |

