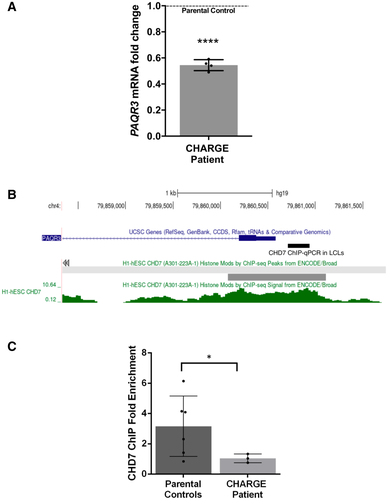
Fig. 4 qPCR analysis of PAQR3 expression in a CHD7 mutation-positive patient compared with parental controls set (N = 4; ****P < 0.0001; Student?s t-test). Fold change was calculated according to the 2 - ? ? C t method, using HPRT1 and RPS1 as housekeeping genes for normalization. All data were expressed as mean fold change ± SD across replicates, relative to control parents set to 1 (dotted line). N is the number of experimental repeats. Schematic view of PAQR3 exon 1 and proximal promoter on chromosome 4 (hg19 assembly), obtained with the UCSC genome browser (https://genome.ucsc.edu/) and showing the sequence amplified in ChIP-qPCR assays in LCLs (thick black line) along with a previously described CHD7 ChIP-seq peak (thick grey line) and signal (green) in H1-hESC (ENCODE3). ChIP-qPCR assays in LCLs showing decreased occupation of CHD7 on the PAQR3 proximal promoter in a CHD7 mutation-positive patient (N = 3) compared with parental controls (N = 6); *P < 0.05; Student?s t-test. All data were expressed as mean fold change ± SD. N is the number of experimental repeats.
Image
Figure Caption
Acknowledgments
This image is the copyrighted work of the attributed author or publisher, and
ZFIN has permission only to display this image to its users.
Additional permissions should be obtained from the applicable author or publisher of the image.
Full text @ EMBO Rep.

