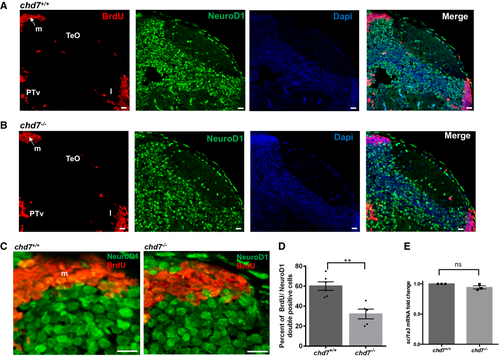
Fig. EV4 A, B. Immunostaining with BrdU and NeuroD1 in brain sections of the zebrafish tectal region in chd7+/+ (A) and chd7−/− (B). The scale bar is 10 μm. Tel: Telencephalon; TeO: tectum opticum, m: medial tectal, DT: dorsal thalamus, PTd: dorsal part of posterior tuberculum, PTv: ventral part of posterior tuberculum, l: lateral tectal proliferation zone. C. Immunostaining with BrdU and NeuroD1 in brain sections of the zebrafish medial tectal region. Scale bar = 10 μm. m: medial tectal. D. The percentage of BrdU and NeuroD1-double positive cells among BrdU-positive cells in the medial tectal zone (N = 3, chd7+/+: n = 6; chd7−/−: n = 6; **P < 0.05; Student’s t-test). E. Expression level of scl1a3 mRNA in chd7−/− relative to chd7+/+ (N = 4). ns, not significant; Student’s t-test. Data information: Data are presented as mean ± SEM. n is the number of fish used. N is the number of experimental repeats.
Image
Figure Caption
Acknowledgments
This image is the copyrighted work of the attributed author or publisher, and
ZFIN has permission only to display this image to its users.
Additional permissions should be obtained from the applicable author or publisher of the image.
Full text @ EMBO Rep.

