
- Title
-
MicroRNA-21 Plays Multiple Oncometabolic Roles in the Process of NAFLD-Related Hepatocellular Carcinoma via PI3K/AKT, TGF-β, and STAT3 Signaling
- Authors
- Lai, C.Y., Yeh, K.Y., Lin, C.Y., Hsieh, Y.W., Lai, H.H., Chen, J.R., Hsu, C.C., Her, G.M.
- Source
- Full text @ Cancers
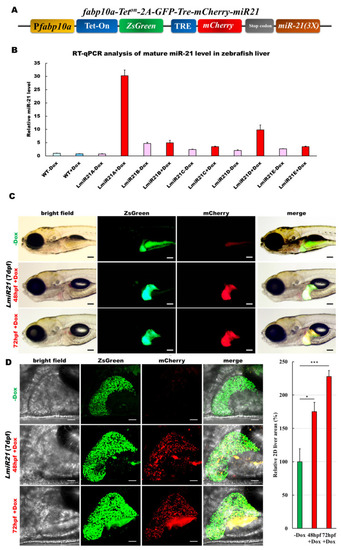
Generation of a liver specific and inducible microRNA (miR)-21 transgenic zebrafish. (A) Schematic diagram of the DNA construct used to generate LmiR21 [Tg(fabp10a-Teton-2A-ZsGreen:mCherry-miR-21)] transgenic zebrafish. Fabp10a promoter drives expression of ZsGreen and tetracycline-inducible transcription factor (Tet-on/off), which controls mCherry and miR-21 expression. (B) Relative quantification of miR-21 expression using (RT-qPCR) analysis. LmiR21#1-5+doxycycline (Dox) represent five independent transgenic lines. Control: wild-type (WT)-Dox and LmiR21#1-5-Dox zebrafish. (C) Liver-specific inducible miR-21 expression in the LmiR21#1 7 days post fertilization (dpf). Transgenic larvae were treated with 25 ?g/mL Dox from 48 or 72 h post fertilization (hpf) to 7 dpf. Scale bar: 100 ?m. (D) Left: images of zebrafish liver; right: 2D measurements of liver area using ImageJ. Scale bar: 50 ?m. (E) Representative photomicrographs of IHC detection of cell proliferation marker-PCNA in zebrafish liver (Left). Scale bar: 50 ?m; Statistical analysis of the percentage of PCNA-positive field. Statistically significant differences from ?Dox group were denoted by * (p < 0.05), ** (p < 0.01) and *** (p < 0.001) for panel D and E. |
Generation of a liver specific and inducible microRNA (miR)-21 transgenic zebrafish. (A) Schematic diagram of the DNA construct used to generate LmiR21 [Tg(fabp10a-Teton-2A-ZsGreen:mCherry-miR-21)] transgenic zebrafish. Fabp10a promoter drives expression of ZsGreen and tetracycline-inducible transcription factor (Tet-on/off), which controls mCherry and miR-21 expression. (B) Relative quantification of miR-21 expression using (RT-qPCR) analysis. LmiR21#1-5+doxycycline (Dox) represent five independent transgenic lines. Control: wild-type (WT)-Dox and LmiR21#1-5-Dox zebrafish. (C) Liver-specific inducible miR-21 expression in the LmiR21#1 7 days post fertilization (dpf). Transgenic larvae were treated with 25 ?g/mL Dox from 48 or 72 h post fertilization (hpf) to 7 dpf. Scale bar: 100 ?m. (D) Left: images of zebrafish liver; right: 2D measurements of liver area using ImageJ. Scale bar: 50 ?m. (E) Representative photomicrographs of IHC detection of cell proliferation marker-PCNA in zebrafish liver (Left). Scale bar: 50 ?m; Statistical analysis of the percentage of PCNA-positive field. Statistically significant differences from ?Dox group were denoted by * (p < 0.05), ** (p < 0.01) and *** (p < 0.001) for panel D and E. |
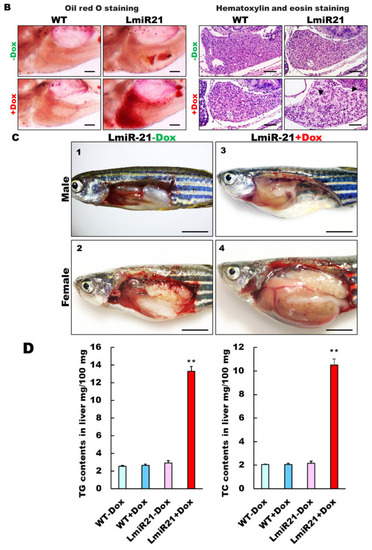
Characterization of hepatic steatosis in LmiR21 larvae and adult. (A) Whole-mount oil-red O (ORO) staining of WT � Dox and LmiR21 � Dox larvae at 21 dpf. Lipid contents in livers and swim bladders were stained by ORO (up). Scale bar: 2 mm. Percentages of WT � Dox and LmiR21 � Dox larvae with weak, moderate and strong levels of hepatic steatosis at 21 dpf (down). Scale bar: 200 ?m. (B) Representative ORO images of liver in 21 dpf larvae (left). Scale bar: 500 ?m. Hematoxylin-eosin (H&E) staining of livers at 21 dpf LmiR21 + Dox larvae show abnormally shaped hepatocytes with lipid vacuoles (arrows) compared with that in the controls at the same stage. Scale bar: 100 ?m. (right). (C) Gross liver phenotypes at 4 months post fertilization (mpf) LmiR21 � Dox. Normal hepatic morphology is clearly composed of lobes in LmiR21 ? Dox adult (panels 1,2). Liver hyperplasia with yellow and greasy phenotypes in LmiR21 + Dox adult liver (panels 3,4). Scale bar: 5 mm. (D) Triglyceride (TG) and total cholesterol (TC) in the livers is greater in LmiR21 + Dox than in the controls (n = 3). Statistically significant differences from LmiR21 ? Dox were denoted by ** (p < 0.01). (E) H&E staining of liver tissue from WT � Dox and LmiR21 � Dox at 4 mpf depicting morphological changes resulting from accumulation of microvesicular steatosis. Scale bar: 50 ?m. (left). ORO staining of liver cryosections from WT � Dox and LmiR21 � Dox adults at 4 mpf. Scale bar: 50 ?m. An abundance of lipid accumulation is observed in LmiR21 + Dox compared to that in controls. (right). (F) Representative liver sections showing ballooned hepatocytes (large arrow) and lipid vacuoles (star) with Masson?s trichrome (left), and Picrosirius red (right). Scale bar: 50 ?m. |
Characterization of hepatic steatosis in LmiR21 larvae and adult. (A) Whole-mount oil-red O (ORO) staining of WT � Dox and LmiR21 � Dox larvae at 21 dpf. Lipid contents in livers and swim bladders were stained by ORO (up). Scale bar: 2 mm. Percentages of WT � Dox and LmiR21 � Dox larvae with weak, moderate and strong levels of hepatic steatosis at 21 dpf (down). Scale bar: 200 ?m. (B) Representative ORO images of liver in 21 dpf larvae (left). Scale bar: 500 ?m. Hematoxylin-eosin (H&E) staining of livers at 21 dpf LmiR21 + Dox larvae show abnormally shaped hepatocytes with lipid vacuoles (arrows) compared with that in the controls at the same stage. Scale bar: 100 ?m. (right). (C) Gross liver phenotypes at 4 months post fertilization (mpf) LmiR21 � Dox. Normal hepatic morphology is clearly composed of lobes in LmiR21 ? Dox adult (panels 1,2). Liver hyperplasia with yellow and greasy phenotypes in LmiR21 + Dox adult liver (panels 3,4). Scale bar: 5 mm. (D) Triglyceride (TG) and total cholesterol (TC) in the livers is greater in LmiR21 + Dox than in the controls (n = 3). Statistically significant differences from LmiR21 ? Dox were denoted by ** (p < 0.01). (E) H&E staining of liver tissue from WT � Dox and LmiR21 � Dox at 4 mpf depicting morphological changes resulting from accumulation of microvesicular steatosis. Scale bar: 50 ?m. (left). ORO staining of liver cryosections from WT � Dox and LmiR21 � Dox adults at 4 mpf. Scale bar: 50 ?m. An abundance of lipid accumulation is observed in LmiR21 + Dox compared to that in controls. (right). (F) Representative liver sections showing ballooned hepatocytes (large arrow) and lipid vacuoles (star) with Masson?s trichrome (left), and Picrosirius red (right). Scale bar: 50 ?m. |

Characterization of hepatic steatosis in LmiR21 larvae and adult. (A) Whole-mount oil-red O (ORO) staining of WT � Dox and LmiR21 � Dox larvae at 21 dpf. Lipid contents in livers and swim bladders were stained by ORO (up). Scale bar: 2 mm. Percentages of WT � Dox and LmiR21 � Dox larvae with weak, moderate and strong levels of hepatic steatosis at 21 dpf (down). Scale bar: 200 ?m. (B) Representative ORO images of liver in 21 dpf larvae (left). Scale bar: 500 ?m. Hematoxylin-eosin (H&E) staining of livers at 21 dpf LmiR21 + Dox larvae show abnormally shaped hepatocytes with lipid vacuoles (arrows) compared with that in the controls at the same stage. Scale bar: 100 ?m. (right). (C) Gross liver phenotypes at 4 months post fertilization (mpf) LmiR21 � Dox. Normal hepatic morphology is clearly composed of lobes in LmiR21 ? Dox adult (panels 1,2). Liver hyperplasia with yellow and greasy phenotypes in LmiR21 + Dox adult liver (panels 3,4). Scale bar: 5 mm. (D) Triglyceride (TG) and total cholesterol (TC) in the livers is greater in LmiR21 + Dox than in the controls (n = 3). Statistically significant differences from LmiR21 ? Dox were denoted by ** (p < 0.01). (E) H&E staining of liver tissue from WT � Dox and LmiR21 � Dox at 4 mpf depicting morphological changes resulting from accumulation of microvesicular steatosis. Scale bar: 50 ?m. (left). ORO staining of liver cryosections from WT � Dox and LmiR21 � Dox adults at 4 mpf. Scale bar: 50 ?m. An abundance of lipid accumulation is observed in LmiR21 + Dox compared to that in controls. (right). (F) Representative liver sections showing ballooned hepatocytes (large arrow) and lipid vacuoles (star) with Masson?s trichrome (left), and Picrosirius red (right). Scale bar: 50 ?m. |

MiR-21 targets |
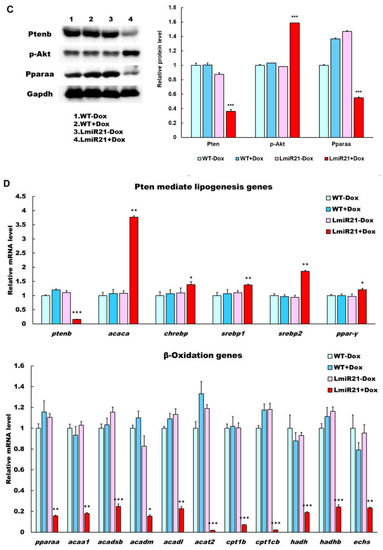
MiR-21 targets |
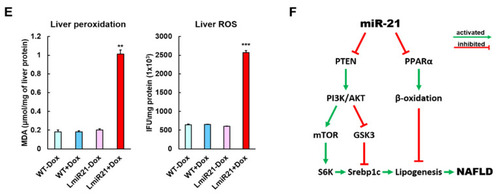
MiR-21 targets |
Development of nonalcoholic steatohepatitis (NASH) phenotypes in LmiR-21 zebrafish at 6 mpf. ( |
Development of nonalcoholic steatohepatitis (NASH) phenotypes in LmiR-21 zebrafish at 6 mpf. ( |
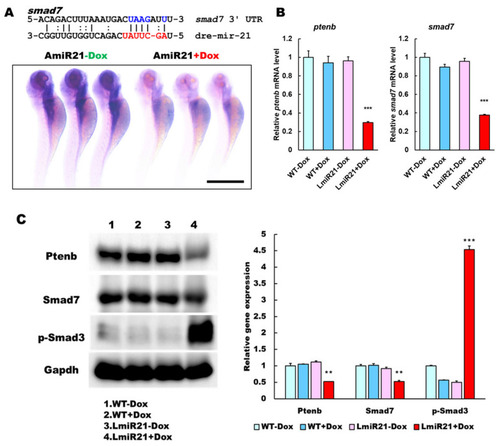
MiR-21 targets smad7 and ptenb in hepatocytes and leads to fibrogenesis. (A) Schematic alignment between the mature miR-21 seed sequence (red) and the smad7 mRNA target sequence (blue) at the 3-UTR. Perfect matches are indicated by a line, and G:U pairs by a colon. Whole mount in situ hybridization assays show significant repression of smad7 mRNA by miR-21 in AmiR+Dox, as compared to AmiR21 ? Dox. Scale bar: 1 mm. (B) RT-qPCR analysis of smad7 and ptenb mRNA expression in the liver of WT � Dox and LmiR21 � Dox fish at 8 mpf. (C) Representative Western blots of Smad7 and PTEN in livers of WT � Dox and LmiR21 � Dox at 8 mpf. (D) Representative images of Masson?s trichrome and Picrosirius red staining of liver tissue from WT�Dox and LmiR21 � Dox at 8 mpf depicting the individual components of advanced fibrosis (as indicated): portal and periportal fibrosis, bridging fibrosis and cirrhosis. Scale bar: 50 ?m. (E) Increased expression of HSC and fibrotic genes in response to Smad7 and PTEN suppression was significantly greater in LmiR21 + Dox at 8 mpf than controls (n = 3). (F) Bilateral-factorial effects of miR-21 in fibrogenesis activation. Statistically significant differences from LmiR21 ? Dox are denoted by * (p < 0.05), ** (p < 0.01) and *** (p < 0.001) for panels B, C and E. |
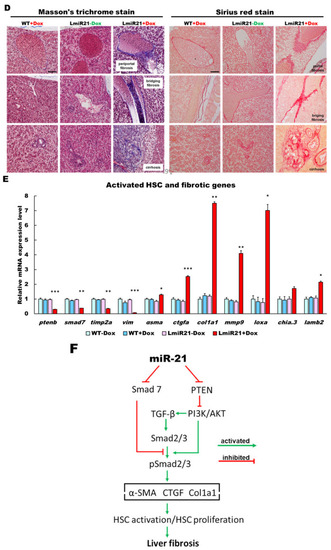
MiR-21 targets smad7 and ptenb in hepatocytes and leads to fibrogenesis. (A) Schematic alignment between the mature miR-21 seed sequence (red) and the smad7 mRNA target sequence (blue) at the 3-UTR. Perfect matches are indicated by a line, and G:U pairs by a colon. Whole mount in situ hybridization assays show significant repression of smad7 mRNA by miR-21 in AmiR+Dox, as compared to AmiR21 ? Dox. Scale bar: 1 mm. (B) RT-qPCR analysis of smad7 and ptenb mRNA expression in the liver of WT � Dox and LmiR21 � Dox fish at 8 mpf. (C) Representative Western blots of Smad7 and PTEN in livers of WT � Dox and LmiR21 � Dox at 8 mpf. (D) Representative images of Masson?s trichrome and Picrosirius red staining of liver tissue from WT�Dox and LmiR21 � Dox at 8 mpf depicting the individual components of advanced fibrosis (as indicated): portal and periportal fibrosis, bridging fibrosis and cirrhosis. Scale bar: 50 ?m. (E) Increased expression of HSC and fibrotic genes in response to Smad7 and PTEN suppression was significantly greater in LmiR21 + Dox at 8 mpf than controls (n = 3). (F) Bilateral-factorial effects of miR-21 in fibrogenesis activation. Statistically significant differences from LmiR21 ? Dox are denoted by * (p < 0.05), ** (p < 0.01) and *** (p < 0.001) for panels B, C and E. |
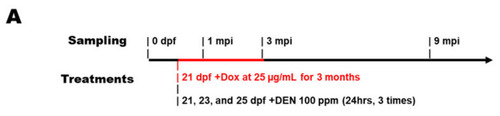
Increased susceptibility of LmiR21 zebrafish to diethylnitrosamine (DEN)-induced liver fibrosis and carcinogenesis. ( |
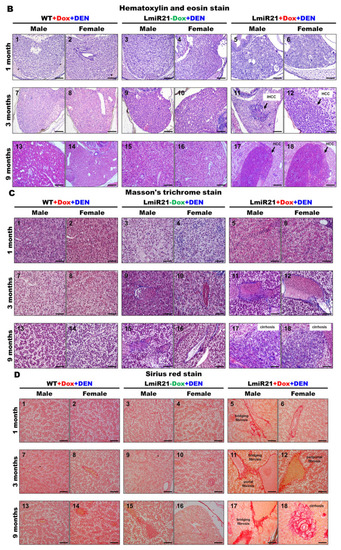
Increased susceptibility of LmiR21 zebrafish to diethylnitrosamine (DEN)-induced liver fibrosis and carcinogenesis. ( |
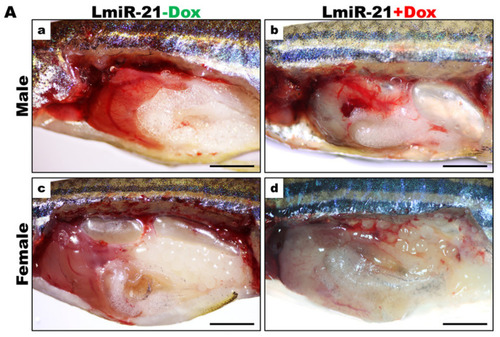
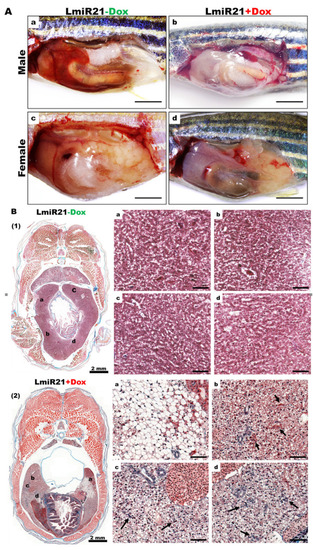
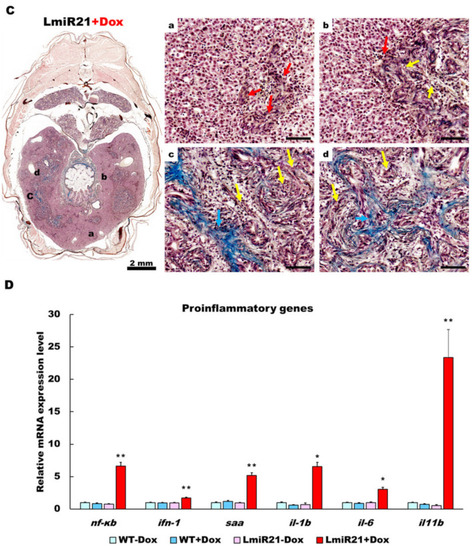
LmiR21 zebrafish develop nonalcoholic hepatocellular carcinoma (NAHCC) phenotypes at 10 months post fertilization (mpf). ( |
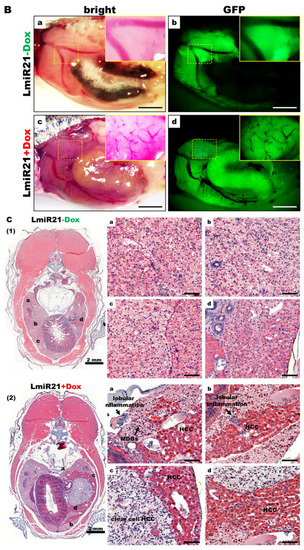
LmiR21 zebrafish develop nonalcoholic hepatocellular carcinoma (NAHCC) phenotypes at 10 months post fertilization (mpf). ( |

LmiR21 zebrafish develop nonalcoholic hepatocellular carcinoma (NAHCC) phenotypes at 10 months post fertilization (mpf). ( |

LmiR21 zebrafish develop nonalcoholic hepatocellular carcinoma (NAHCC) phenotypes at 10 months post fertilization (mpf). ( |
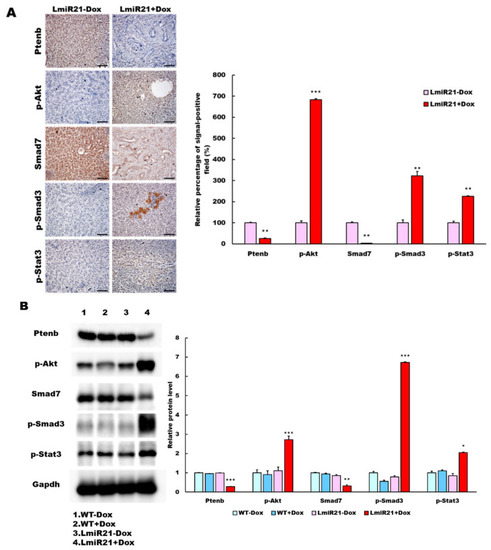
MiR-21 expression shows a direct correlation with activation of PI3K, TGF-β and STAT3 (PTS) signaling network proteins in LmiR21 zebrafish and human nonviral hepatocellular carcinomas (HCC). ( |
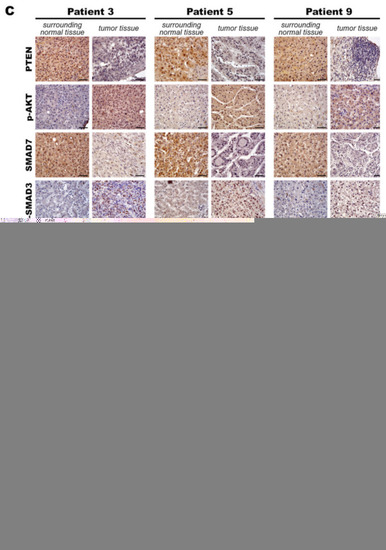
MiR-21 expression shows a direct correlation with activation of PI3K, TGF-β and STAT3 (PTS) signaling network proteins in LmiR21 zebrafish and human nonviral hepatocellular carcinomas (HCC). ( |
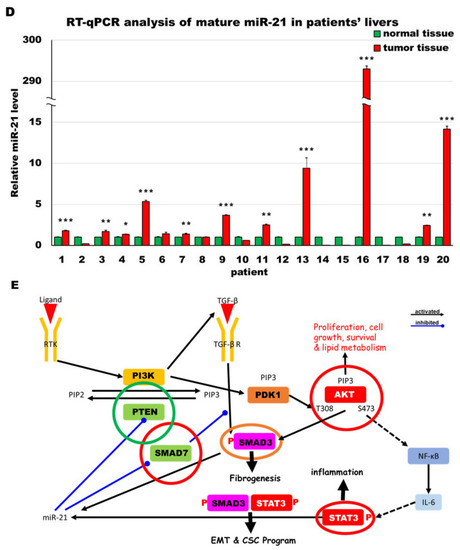
MiR-21 expression shows a direct correlation with activation of PI3K, TGF-β and STAT3 (PTS) signaling network proteins in LmiR21 zebrafish and human nonviral hepatocellular carcinomas (HCC). ( |