FIGURE SUMMARY
Title

Comparison of zebrafish and mice knockouts for Megalencephalic Leukoencephalopathy proteins indicates that GlialCAM/MLC1 forms a functional unit

Authors
Pérez-Rius, C., Folgueira, M., Elorza-Vidal, X., Alia, A., Hoegg-Beiler, M.B., Eeza, M.N.H., Díaz, M.L., Nunes, V., Barrallo-Gimeno, A., Estévez, R.
Source
Full text @ Orphanet J Rare Dis

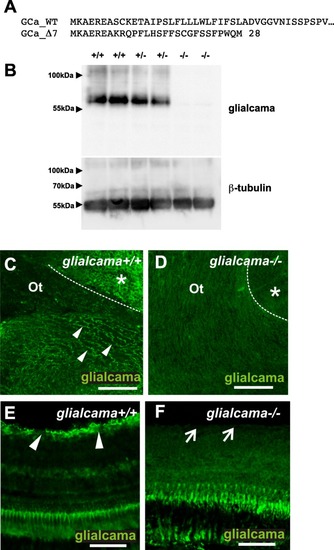
Generation of a glialcama knockout line in zebrafish. a An allele with a deletion of 7 nucleotides in glialcama (Δ7, from now on −/−) was generated using a TALEN nuclease. The deletion generates an early stop codon, resulting in a protein of only 28 amino acids in lenght. b Western blot of brain extracts from adult wild-type (+/+), heterozygous (+/−) or homozygous mutant (−/−) fish for the glialcama knockout allele demonstrates the absence of the glialcama protein in the homozygous zebrafish. c glialcama expression in the optic tract (Ot) (arrowheads) and diffusely in cell bodies of the preoptic region (asterisk) of wild type fish (dotted line: optic tract/preoptic region boundary). d No glialcama immunoreactivity is observed in the optic tract or brain parenchyma of glialcama knockout fish. Dotted line: optic tract/preoptic region boundary. Asterisk: preoptic region. e glialcama immunoreactivity is observed in the inner limiting membrane of the wild type retina (arrowheads). f No glialcama immunoreactivity is observed in knockout retina. Expression observed in glialcama−/− represents autofluorescence in photoreceptors that was consistently observed, even in the case of control immunostainings with secondary antibody only. Arrows point to the inner limiting membrane. Scale bars: 60 μm (e, f); 75 μm (c, d)

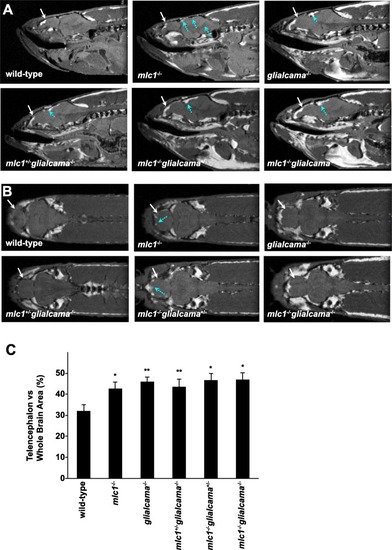
MR images of wild-type and various zebrafish mutants. a The sagittal slices were obtained with an in-plane resolution of 47 μm. The size of telencephalon was bigger in mutant zebrafish as compared to wild type (white arrows). Lesions in mesencephalon in mutants are shown with blue arrows. b The coronal slices were obtained with an in-plane resolution of 47 μm. The size of telencephalon was bigger in mutant zebrafish as compared to wild type (white arrows). Lesions in telencephalon are shown with blue arrows. c Telencephalon vs. whole brain area (%). In order to compare the size of the telencephalon relative to the whole brain of the different groups one-way analysis of variance (ANOVA) was performed and indicated that the size was larger in all mutants as compared to wild type (*p < 0.05; **p < 0.005) (n = 3). No statistical differences were observed in the percent area of telencephalon versus whole brain size between single knockout zebrafish for one gene with the single knockout/heterozygous or the double knockout (p > 0.05) (see Additional file 3: Table S1)

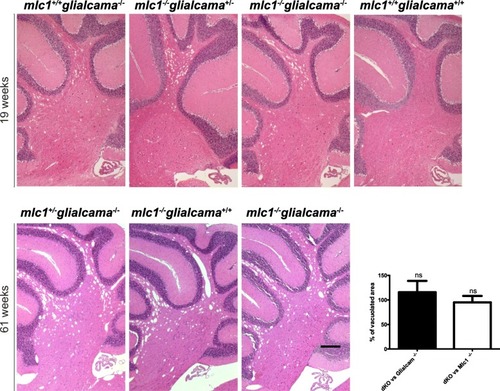
Myelin vacuolization in Glialcam−/−, Mlc1−/− and Glialcam−/−Mlc1−/− mouse models. Haematoxylin-eosin staining of sagittal sections of the cerebellum of 19- and 61-week-old mice showed similar levels of myelin vacuolization in Glialcam−/−, Mlc1−/− and Glialcam−/−Mlc1−/− animals. As a control we show the same area of a wild-type mouse at 19 weeks. The inset shows the percentage of vacuolation in double KO animal versus the vacuolation observed in Glialcam KO animals (n = 3) and Mlc1 KO animals (n = 3) considering each age independently, without substracting the minor vacuolization observed in wild-type animals. Data were analyzed by GraphPad Prism software. In order to compare the different groups (dKO vs Glialcam−/− and dKO vs Mlc1−/−), one-way analysis of variance (ANOVA) followed by post-hoc Bonferroni’s multiple comparison test was used. ns: not significative. Scale bar, 400 μm

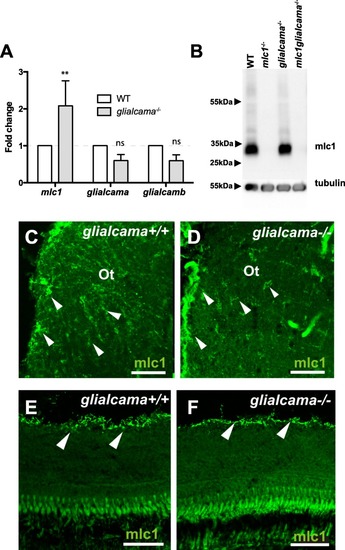
mlc1 expression and localization in glialcama−/− zebrafish. a Quantitative real-time PCR to determine levels of glialcama, glialcamb and mlc1 messenger RNA in the brain of glialcama−/− zebrafish. Bars, relative expression levels compared with WT sibling; error bars, s.e. (n ≥ 3). **P < 0.01 (vs. wild-type, two-way ANOVA) b Comparison of mlc1 protein levels in brain of wild-type (WT), mlc1−/−, glialcama−/− and mlc1glialcama−/− zebrafish by Western blots of extracts from 5-months-old zebrafish. Western blot is representative of three independent experiments. Tubulin served as a loading control. c, d mlc1 expression (arrowheads) observed in the optic tract of both wild type (c) and glialcama−/− (d) brains. e, f mlc1 expression is restricted to the inner limiting membrane of the retina (arrowheads) both in wild type (e) and glialcama−/− (f). Scale bars: 50 μm (c, d); 60 μm (e, f)

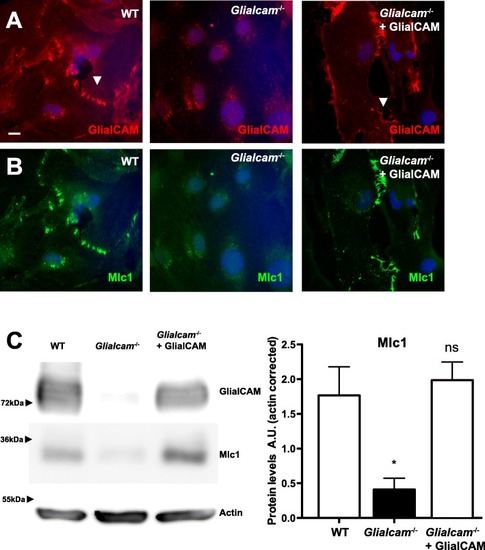
Mlc1 is mislocalized in primary Glialcam−/− astrocytes. Localization of GlialCAM (a) and Mlc1 (b) in primary astrocytes from wild-type (WT, left), Glialcam−/− (middle) and Glialcam−/− complemented with adenoviruses expressing human GlialCAM (right). In WT and complemented astrocytes, GlialCAM and Mlc1 are located at cell-cell junctions (arrowheads). Scale bar: 10 μm. (c) GlialCAM and Mlc1 protein levels primary astrocytes from wild-type (WT, left), Glialcam−/− (middle) and Glialcam−/− complemented with an adenoviruss expressing human GlialCAM. Actin served as a loading control. Two other independent experiments gave similar results. Densitometric analysis (n = 3) indicates that Mlc1 levels were reduced in astrocytes from Glialcam−/− mice and expression was recovered after expression of GlialCAM using adenoviruses. * p < 0.05 vs wild-type astrocytes

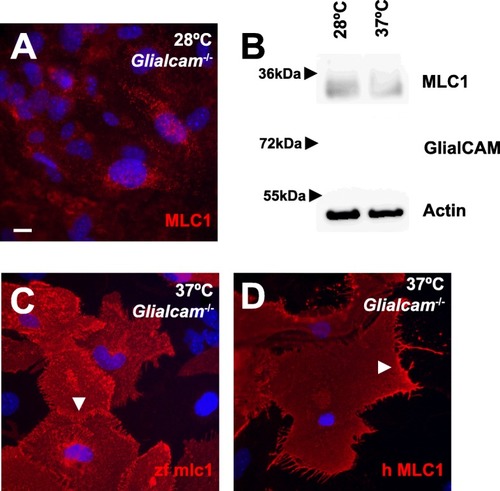
zfmlc1 and hMLC1 overexpressed in primary Glialcam−/− astrocytes are located at cell-cell junctions. a, b Primary astrocytes isolated from Glialcam−/− mice were incubated for 18 h at 28 °C. Then, MLC1 was detected by immunofluoresce (a) and protein levels were monitored by Western blot (b). Actin served as a loading control. Lack of signal using GlialCAM antibodies confirmed the lack of protein expression. c, d Overexpression using adenoviruses of mlc1 from zebrafish (zfmlc1, c) and human HA-tagged MLC1 (hMLC1, d) detected both MLC1 proteins at cell-cell junctions (arrowheads) in primary astrocytes isolated form Glialcam−/− mice. We used antibodies detecting the zebrafish MLC1 or the HA epitope, which did not detect the endogenous Mlc1. Scale bar: 10 μm

ZFIN is incorporating published figure images and captions as part of an ongoing project. Figures from some publications have not yet been curated, or are not available for display because of copyright restrictions.

Acknowledgments
This image is the copyrighted work of the attributed author or publisher, and ZFIN has permission only to display this image to its users. Additional permissions should be obtained from the applicable author or publisher of the image. Full text @ Orphanet J Rare Dis