- Title
-
Deletion of Mtu1 (Trmu) in zebrafish revealed the essential role of tRNA modification in mitochondrial biogenesis and hearing function
- Authors
- Zhang, Q., Zhang, L., Chen, D., He, X., Yao, S., Zhang, Z., Chen, Y., Guan, M.X.
- Source
- Full text @ Nucleic Acids Res.
|
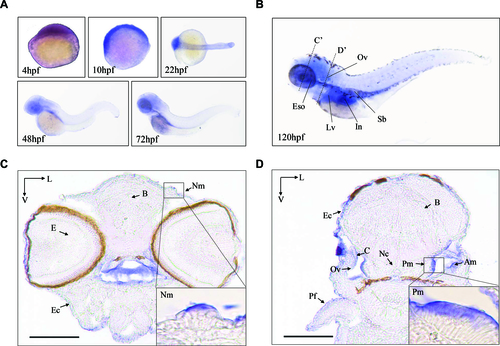
The expression patterns of Zebrafish Mtu1 in the sensory organs. (A) Whole-mount in situ hybridization on wild type larval zebrafish at various ages (4?72 hpf). (B) Lateral views with anterior to the left show mtu1 expression in otic vesicle (Ov), liver (Lv), esophagus (Eso), swimming bladder (Sb) and intestine (In) at 120 hpf. (C, D) Transverse frozen sections through dashed line C? and D? in B were used for the assessment of mtu1 expression in neuromast (Nm), posterior macula (Pm) and anterior macula (Am) hair cells, respectively. Insets show higher magnifications of Nm and Pm. Scale bars: 100 ?m. V, ventral; L, lateral; B: brain; E: eye; Pf: pectoral fin; Ec: epidermal cells; C: cristae; Nc: notochord. |
|
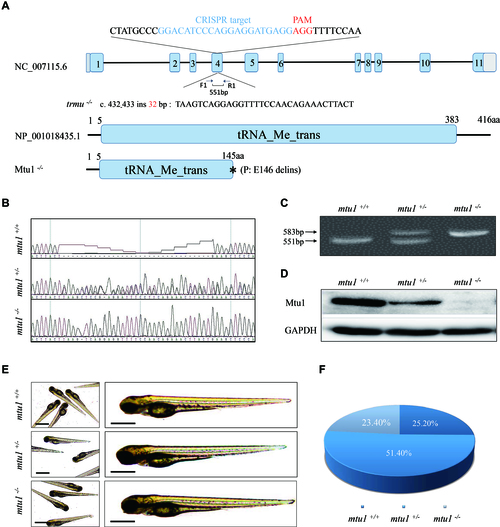
Generation of mtu1 knock-out zebrafish using CRISPR/Cas9 system. (A) Schematic representation of CRISPR/Cas9 target site at exon 4 as used in this study. An allele, mtu1ins32bp was produced by a 32 bp insertion in exon 4 and a truncated 145 amino acid non-functional protein. (B?D) Genotyping of mtu1ins32bp by Sanger sequence, the PAGE RFLP and Western blot analyses. (E) The morphology of mtu1?/?, mtu1+/? and mtu1+/+ zebrafish at 3 dpf. (F) The ratios of genotypes/phenotype of offsprings (F2) in clutches from different F1 mtu1 heterozygous crosses at 10 dpf (n = 350). PHENOTYPE:
|
|
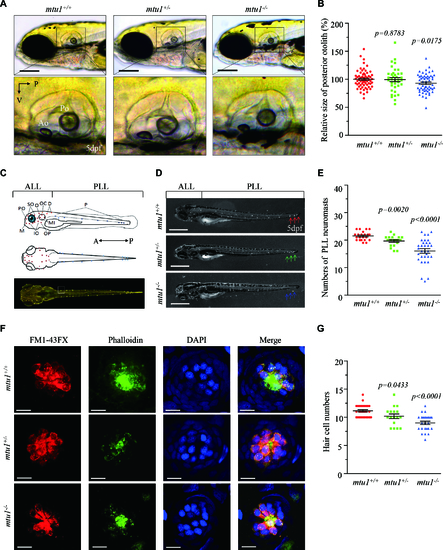
Defects in hearing organs in zebrafish at 5 dpf. (A) Otolith morphologies of mtu1?/?, mtu1+/? and mtu1+/+ zebrafish were illustrated under a Leica microscope with an objective magnification of 20 X. Lateral views of the otic vesicle were shown in the low arrows. V, ventral; P, posterior. (B) Quantification of sizes of posterior otolith in the mtu1?/?(n = 98), mtu1+/? (n = 95) and mtu1+/+ (n = 99) zebrafish. (C) Lateral and dorsal views of zebrafish larvae show the distribution of neuromasts along the body. A, anterior; P, posterior. (D) Larval of mtu1?/?, mtu1+/? and mtu1+/+ zebrafish were fluorescently labeled with FM1-43FX and observed under a stereoscopic microscope with an objective magnification of 20 X. Neuromast numbers of anterior lateral line (ALL) and posterior lateral line (PLL) in mutant and wild type fishes were counted, respectively. The arrows indicated the positions where the number of neuromasts were significantly reduced in the mutant fishes. (E) Quantification of neuromasts numbers of posterior lateral line (PLL) from the mtu1?/?, mtu1+/? mutant and wild type zebrafish. The calculations were based on the numbers of mtu1?/? (n = 32), mtu1+/? (n = 20) and mtu1+/+ (n = 21) larvae. (F) The hair cells, stereocilia and nuclei of neuromas from mutant and wild type zebrafish were stained with FM1-43FX (red), phalloidin (green) and DAPI (blue), respectively. Scale bars = 10 ?m. (G) Quantification of numbers of hair cells for the mtu1?/?(n = 25), mtu1+/? (n = 17) and mtu1+/+ (n = 28) zebrafish. Graph details and symbols are explained in the legend to Figure 3. PHENOTYPE:
|
|
Reduced density of hair cell bundles in inner ear labyrinth. (A) Anatomy of adult wild type zebrafish inner ear labyrinth, showing two lagenas (L), two saccule (S), and two utricle (U). (B?D) Hair bundle density in lagenas, saccule and utricle. The hair cells, nuclei of from mutant and wild type zebrafish were stained with phalloidin (green) and DAPI (blue), respectively. Hair cell counts were sampled at six locations of lagenas, four locations of saccule and six locations of utricle, respectively. A 1600 ?m2 box was placed at each sampling area and labeled hair cell bundles were counted within each box to determine hair cell density were selected for counting. A, anterior; D, dorsal; M, medial; P, posterior; V, ventral. (E). Quantification of density of hair cell bundles for the mtu1?/?, mtu1+/? and mtu1+/+ zebrafish. Graph details and symbols are explained in the legend to Figure 3. PHENOTYPE:
|
|
Mitochondrial defects in hair cells. (A) Assessment of mitochondrial function in hair cells by enzyme histochemistry (EHC) staining for SDH and COX in the frozen-sections of posterior macula of mtu1?/?, mtu1+/? and mtu1+/+ zebrafish at 5dpf. Loss of EHC signal is indicated by arrows (magnification X400). V, ventral; L, lateral; Ov, otic vesicle; Hc, hair cell; Sc, supporting cell. (B) Mitochondrial networks from hair cells of inner electron microscopy. Ultrathin sections were visualized with 5000×, 10 000×, 20 000× and 60 000× magnifications. (C) Quantification of mitochondrial numbers of hair cells from the mtu1?/?, mtu1+/? mutant and mtu1+/+ zebrafish. The calculations were based on 50 different hair cells of mtu1?/?, mtu1+/? mutant and mtu1+/+ zebrafish, respectively. Graph details and symbols are explained in the legend to Figure 3. |
|
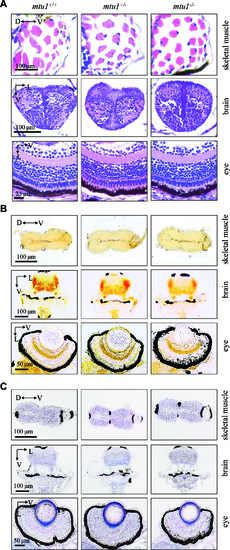
mtu1?/? zebrafish at 5 dpf did not show the defects in muscle, brain and eyes. (A) Hematoxylin and eosin (HE) staining of skeletal muscles, brain and eye in the wild type (mtu1+/+), mtu1+/? and mtu1?/? zebrafish at 5 dpf. (B) Succinate dehydrogenase (SDH) and (C) cytochrome c oxidase (COX) staining of skeletal muscles, brain and eye in wild type (mtu1+/+), mtu1+/? and mtu1?/? zebrafish at 5 dpf. D, dorsal; P, posterior; V, ventral; L, lateral. PHENOTYPE:
|
|
(A) Balance/orientation in the mtu1-/-, mtu1+/- and wildtype fish at 5 dpf is shown. The red arrow indicates those abnormally swimming zebrafish, such as frequently sanking to the bottom of the dishes in the head down position and slowly settled their lateral side. (B) Quantification of the levels of abnormal swimming behavior in the mtu1-/- (n=196), mtu1-/- (n=200) and mtu1+/+ (n=189) zebrafish. (C) Zebrafish larvae corresponding to the artificial startle stimulus. Images were captured right before (0 s, yellow) and after (1 s, purple; 2 s, cyan) the stimulus, and then overlapped using image J software. The red arrows indicated representative non-responders. The motion curves were indicated by dashed lines. (D) Quantification of the average movement distance in the mtu1-/-(n=30), mtu1+/- (n=40) and mtu1+/+ (n=45). The error bars indicate standard errors; p indicates the significance, according to Student's t test, of the difference between mutant and wild type. PHENOTYPE:
|
|
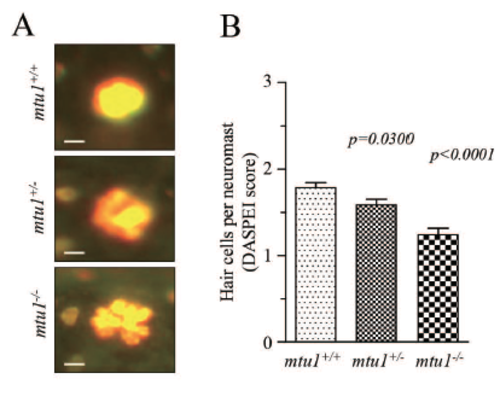
(A) Representative image of DASPE labeled hair cells from the mtu1+/+ and mtu1+/- mutants and wildtype fishes at 5 dpf. (B) Selected the SO1 SO2 OC1 D1 and the L1 to assess states of the neuromasts at 5 dpf zebrafish larvae. |

Unillustrated author statements |

