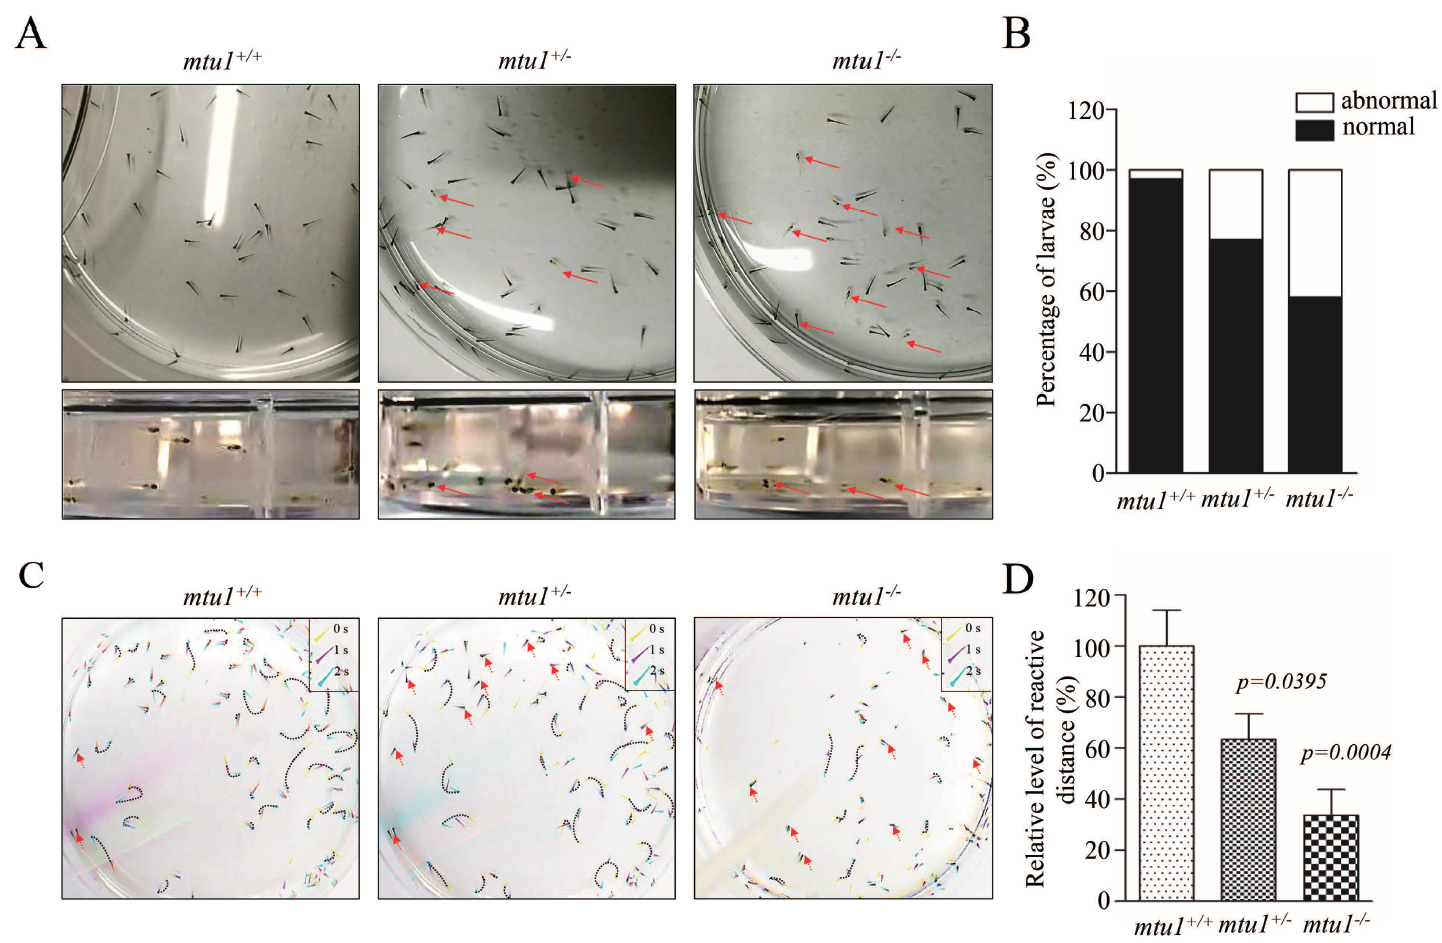
Fig. S2
(A) Balance/orientation in the mtu1-/-, mtu1+/- and wildtype fish at 5 dpf is shown. The red arrow indicates those abnormally swimming zebrafish, such as frequently sanking to the bottom of the dishes in the head down position and slowly settled their lateral side. (B) Quantification of the levels of abnormal swimming behavior in the mtu1-/- (n=196), mtu1-/- (n=200) and mtu1+/+ (n=189) zebrafish. (C) Zebrafish larvae corresponding to the artificial startle stimulus. Images were captured right before (0 s, yellow) and after (1 s, purple; 2 s, cyan) the stimulus, and then overlapped using image J software. The red arrows indicated representative non-responders. The motion curves were indicated by dashed lines. (D) Quantification of the average movement distance in the mtu1-/-(n=30), mtu1+/- (n=40) and mtu1+/+ (n=45). The error bars indicate standard errors; p indicates the significance, according to Student's t test, of the difference between mutant and wild type.

