- Title
-
Loss of the novel Vcp (valosin containing protein) interactor Washc4 interferes with autophagy-mediated proteostasis in striated muscle and leads to myopathy in vivo
- Authors
- Kustermann, M., Manta, L., Paone, C., Kustermann, J., Lausser, L., Wiesner, C., Eichinger, L., Clemen, C.S., Schröder, R., Kestler, H.A., Sandri, M., Rottbauer, W., Just, S.
- Source
- Full text @ Autophagy
|
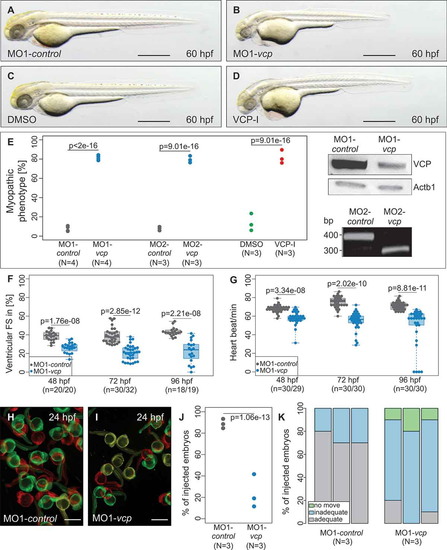
Phenotypic analysis of zebrafish after morpholino-mediated knockdown of vcp or ML240 treatment. (a to d) Lateral view of embryos at 60 hpf. Zebrafish embryos were either injected with 5 base pair (bp) mismatch vcp start morpholino (MO1-control; a) and vcp start MO (MO1-vcp; b) or treated with DMSO (c) and VCP-Inhibitor ML240 (VCP-I; d). scale bar: 500 ?m (a, c); scale bar: 650 ?m (b, d). (e) Statistical analysis of affected embryos after MO1/2-control or MO1/2-vcp injection and DMSO or ML240 treatment. N = 3/4 Experiments with in total n = 259 (MO1-control), n = 161 (MO2-control), n = 242 (MO1-vcp), n = 212 (MO2-vcp), n = 152 (DMSO), n = 148 (VCP-I); N two-sided Fisher exact tests combined with a modified Fisher method. Ratios of N experiments are displayed. MO1-vcp-injected embryos reveal reduced levels of Vcp by western blot analysis. Actb1/?-actin was used as loading control. RT-PCR after MO2-vcp injection shows specific effect on mRNA splicing. (f) Ventricular fractional shortening (FS) measurements of MO1-control and MO1-vcp-injected embryos at 48, 72 and 96 hpf, n = 18 to 30 (MO1-control), n = 19 to 32 (MO1-vcp). The individual measurements are shown (two-sided Wilcoxon rank-sum test). (g) Heart beat per minute at 48, 72 and 96 hpf of vcp morphants and control embryos. n = 30 (MO1-control), n = 29 or 30 (MO1-vcp). The individual measurements are shown (two-sided unpaired Wilcoxon rank-sum test. (h and i) False-colored superimposed overviews of spontaneous movement assay with MO1-control- (h) and MO1-vcp-injected (i) embryos at 24 hpf; red pictures = 0 s; green pictures = 10 s; yellow = merge. scale bar: 1 mm. (j) Quantification of spontaneous movement assay; N = 3 experiments with n = 30 (MO1-control), n = 29 or 30 (MO1-vcp) per experiment (N two-sided Fisher exact tests combined with modified Fisher method). The ratios of N experiments are shown. (k) Statistical analysis of touch-evoke flight response of control and vcp morphants at 72 hpf. n = 30, N = 3 (MO1-control), n = 29 or 30, N = 3 (MO1-vcp); data represent means. |
|
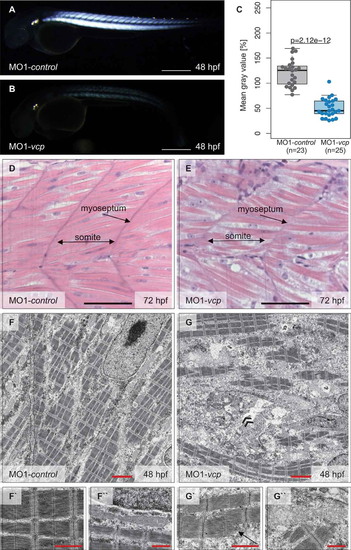
Vcp deficiency results in a severe skeletal muscle myopathy. (a and b) Lateral view of control (a) and vcp morphants (b) showing birefringence at 48 hpf. scale bar: 450 ?m. (c) Densitometric analysis of birefringence (n = 23/25). Individual samples are shown (two-sided Wilcoxon rank-sum test). (d and e) Skeletal muscle H&E-stained sagittal histological sections of MO1-control- (d) and MO1-vcp-injected embryos (e) at 72 hpf; scale bar: 100 ?m. (f to g``) Transmission electron microscopy in control embryos (f to f``) and vcp morphants (g to g``) at 48 hpf. (f to f``) MO1-control-injected embryos show organized myofibrils and sarcomeric units with highly structured thick and thin filaments (f`) and mitochondria with many cristae (f``). (g to g``) VCP-deficient muscle cells present disorganized myofibrils with Z-disc alterations (arrow, g`), dysmorphic mitochondria (g``) and an accumulation of numerous vesicular bodies (double arrowheads, g); scale bar: 2.5 ?m (f, g); scale bar: 1 ?m (f` and f``, g` and g``). PHENOTYPE:
|
|
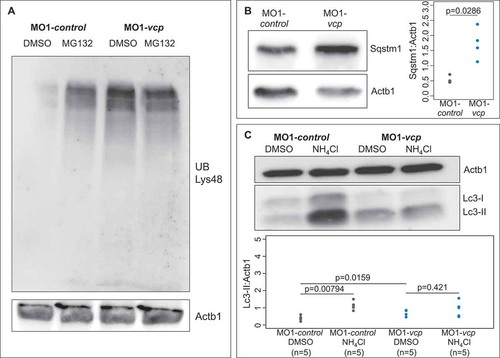
Inactivation of Vcp leads to an accumulation of ubiquitinated proteins and Sqstm1. (a) Western blot analysis using an anti-K48-linkage specific ubiquitin antibody after MO1-control and MO1-vcp injection and DMSO or MG132 treatment (n = 4). (b) Vcp morphants show a significant increase of Sqstm1 by western blot analysis (n = 3); quantification of gray values. Actb1/?-actin was used as loading control. Data represent means ± SD, unpaired Student t test, *P value< 0.03 (c) Western blot analysis of Lc3 after MO1-control and MO1-vcp injection and DMSO or Ammonium chloride (NH4Cl) treatment (top) and quantification of gray values (bottom). NH4Cl treated control embryos reveal significant increase of Lc3-II levels, compared to DMSO treated embryos (n = 5). Actb1/?-actin was used as loading control. The individual samples are displayed (two-sided Wilcoxon rank-sum test). EXPRESSION / LABELING:
PHENOTYPE:
|
|
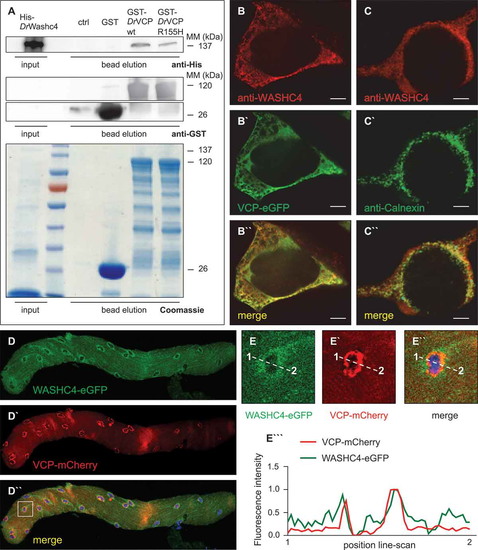
VCP and its interactor WASHC4 colocalize in HEK293T cells and mouse FDB fibers. (a) Western blot analysis of a representative Washc4 pull-down experiment using anti-His (upper panel) and anti-GST (middle and lower panels) antibodies. Extracts of E. coli cells expressing recombinant His-tagged zebrafish (Danio rerio, Dr) Washc4 (His-DrWashc4) were incubated with either no beads (ctrl) or glutathione beads carrying GST (GST), GST?DrVcp wt or GST?DrVcpR155H. Coomassie stained SDS?PAGE gel of a Washc4 affinity isolation experiment (lower panel). ctrl = beads incubated with PBS. (b to b``) Transfection of HEK293T cells using a VCP-eGFP expression construct (b`) and staining with an anti-WASHC4 antibody (b) show cytoplasmic colocalization of both proteins. (c to c``) HEK293T cell immunostaining of CANX (c`) and WASHC4 (c) display colocalization at the endoplasmic reticulum. Scale bar = 5 µm. (d to d``) FDB muscle fiber of a male CD1 mouse transfected with WASHC4-eGFP (d) and VCP-mCherry (d`) expressing constructs demonstrated colocalization of both proteins. (e to e``) Close-ups of the squared area of the FDB muscle fiber of D``. (e```) Line-scan profiles demonstrated overlapping fluorescence intensities. Cell nuclei were counterstained with DAPI. |
|
Phenotypic analysis washc4 morpholino-mediated knockdown in zebrafish embryos. (a to d) Lateral view of embryos at 48-hpf injected with washc4 5 bp mismatch start or splice morpholino (MO1/2-control; a, c) or washc4 start or splice MO (MO1/2-washc4; b, d). MO1/2- washc4 injection leads to a myopathic phenotype (b, d). scale bar: 450 ?m. (e) Quantification of myopathic embryos after MO1/2-control or MO1/2- washc4 injection. N = 3/4 Experiments with in total n = 290 (MO1-control), n = 238 (MO2-control) n = 226 (MO1- washc4), n = 259 (MO2- washc4). The data were analyzed via N two-sided Fisher exact tests combined with a modified Fisher combination. The ratios of N experiments are shown. Western blot analysis shows reduction of Washc4 protein level in MO1-washc4-injected embryos. Actb1/?-actin was used as loading control. MO2-washc4 injection effects on mRNA splicing shown by RT-PCR. (f) Ventricular fractional shortening (FS) measurements at 48, 72 and 96 hpf of control and washc4 morphants. n = 30 (MO1-control), n = 30 (MO1-washc4); The individual measurements are shown (two-sided Wilcoxon rank-sum test). (g) Heart beat per minute of MO1-control- or MO1-washc4-injected embryos at 48, 72 and 96 hpf. n = 30 (MO1-control), n = 30 (MO1- washc4). The individual measurements are shown (two-sided Wilcoxon rank-sum test). (h, i) Spontaneous movement assay shown by false-colored superimposed pictures of control embryos (h) or Washc4 morphants (i) at 24 hpf; red pictures = 0 s; green pictures = 10 s; yellow = merge. scale bar: 1 mm. (j) Statistical analysis of spontaneous movement assay; N = 3 experiments with in total n = 56 (MO1-control), n = 60 (MO1-washc4) were performed (N two-sided Fisher exact tests combined with a modified Fisher method). The ratios of N experiments are shown. (k) Quantification of touch-evoke flight response assay of MO1-control- or MO1-washc4-injected embryos at 60 hpf. n = 40, N = 3 (MO1-control), n = 40, N = 3 (MO1-washc4); data represent means. |
|
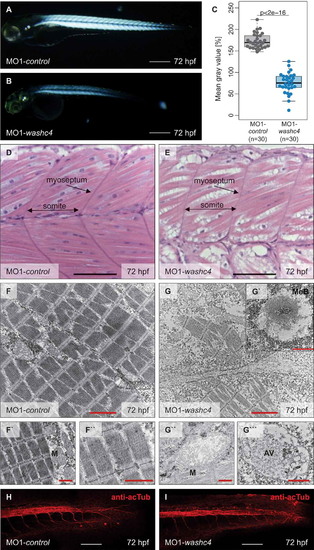
Inactivation of Washc4 in zebrafish embryos results in skeletal muscle ultrastructural alterations. (a and b) Lateral view of MO1-control- (a) and MO1-washc4-injected (b) embryos showing birefringence at 72 hpf. scale bar: 400 ?m. (c) Statistical analysis of birefringence signal. n = 30 (MO1-control), n = 30 (MO1-washc4); two-sided Wilcoxon rank-sum tests. (d and e) H&E-stained sagittal histological sections of skeletal muscle of control embryos (d) and Washc4 morphants (e) at 72 hpf; scale bar = 100 ?m. (f to g```) Transmission electron microscopy in MO1-control (f to f``) and MO1-washc4 (g to g```) skeletal muscle at 72 hpf. (f to f``) Control muscle cells exhibit highly organized myofibrils (f``) and normal mitochondria, next to the sarcomeric Z-discs (f`). (g to g``) Washc4 morphant muscle cells show less myofibrils, dysmorphic mitochondria (g``) and an accumulation of various vesicular structures; AV = autophagic vesicle, M = mitochondria, MeB = membranous bodies; scale bar: 2 ?m (f, g); scale bar = 1 ?m (f` and f``, g` to g```). (j and k) Immunostaining using an anti-acetylated tubulin (acTub) antibody of MO1-control- (j) or MO1-washc4-injected (k) embryos at 72 hpf. scale bar: 200 ?m. EXPRESSION / LABELING:
PHENOTYPE:
|
|
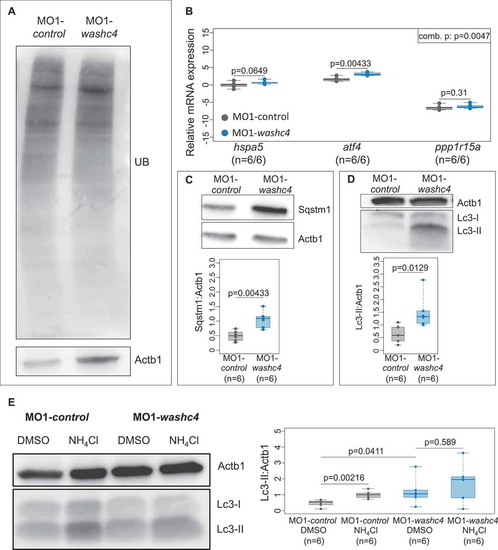
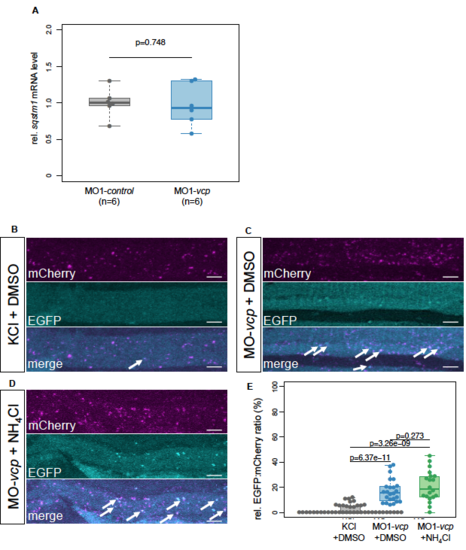
Loss of Washc4 leads to an upregulation of ER stress markers and to an impaired autophagy. (a) Western blot analysis of ubiquitinated proteins after MO1-control and MO1-washc4 injection. (b) qRT-PCR of ER stress markers (hspa5, atf4 and ppp1r15a) of control embryos or washc4 morphants at 3 dpf. The individual measurements are shown (log10). The 3 markers were analyzed via Wilcoxon rank-sum tests. A combined P value (comb. p) was determined via a modified Fisher method. slc25a5 was used as housekeeping gene. (c) Western blot analysis using anti-Sqstm1 antibody after MO1-control and MO1-washc4 injection (upper panel); quantification of gray values (lower panel; n = 6). (d) Representative western blotting of Lc3 of control embryos or washc4 morphants (upper panel); quantification of gray values (lower panel; n = 6). Individual measurements are shown (Wilcoxon rank-sum test). (e) MO1-control-or MO1-washc4-injected embryos treated with DMSO or ammonium chloride (NH4Cl). Control embryos show a significant increase of Lc3-II levels after NH4Cl treatment in comparison to DMSO controls. Ammonium chloride treatment of Washc4 morphants did not significantly enhance the Lc3-II level in comparison to DMSO treated embryos (n = 6). Actb1/?-actin was used as loading control. The individual measurements are shown (Wilcoxon rank-sum test). EXPRESSION / LABELING:
PHENOTYPE:
|
|
|
|
|
|
|
|
|
|
|

