
|
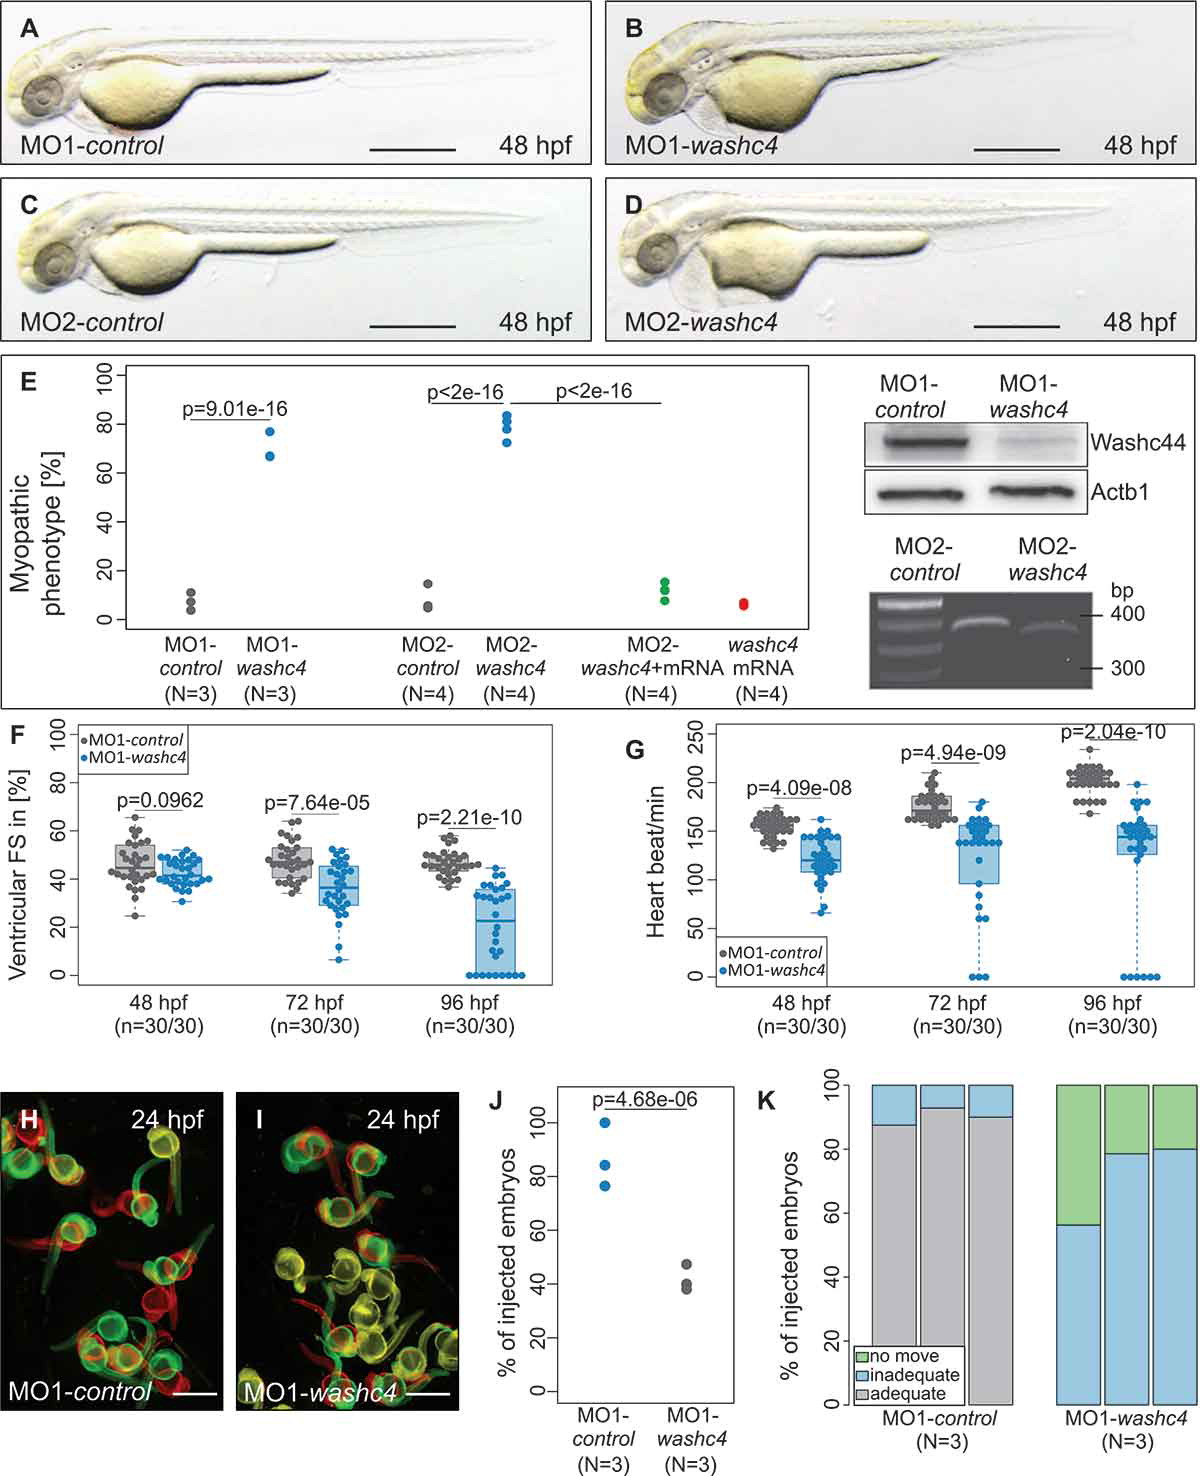
Fig. 5
Phenotypic analysis washc4 morpholino-mediated knockdown in zebrafish embryos. (a to d) Lateral view of embryos at 48-hpf injected with washc4 5 bp mismatch start or splice morpholino (MO1/2-control; a, c) or washc4 start or splice MO (MO1/2-washc4; b, d). MO1/2- washc4 injection leads to a myopathic phenotype (b, d). scale bar: 450 ?m. (e) Quantification of myopathic embryos after MO1/2-control or MO1/2- washc4 injection. N = 3/4 Experiments with in total n = 290 (MO1-control), n = 238 (MO2-control) n = 226 (MO1- washc4), n = 259 (MO2- washc4). The data were analyzed via N two-sided Fisher exact tests combined with a modified Fisher combination. The ratios of N experiments are shown. Western blot analysis shows reduction of Washc4 protein level in MO1-washc4-injected embryos. Actb1/?-actin was used as loading control. MO2-washc4 injection effects on mRNA splicing shown by RT-PCR. (f) Ventricular fractional shortening (FS) measurements at 48, 72 and 96 hpf of control and washc4 morphants. n = 30 (MO1-control), n = 30 (MO1-washc4); The individual measurements are shown (two-sided Wilcoxon rank-sum test). (g) Heart beat per minute of MO1-control- or MO1-washc4-injected embryos at 48, 72 and 96 hpf. n = 30 (MO1-control), n = 30 (MO1- washc4). The individual measurements are shown (two-sided Wilcoxon rank-sum test). (h, i) Spontaneous movement assay shown by false-colored superimposed pictures of control embryos (h) or Washc4 morphants (i) at 24 hpf; red pictures = 0 s; green pictures = 10 s; yellow = merge. scale bar: 1 mm. (j) Statistical analysis of spontaneous movement assay; N = 3 experiments with in total n = 56 (MO1-control), n = 60 (MO1-washc4) were performed (N two-sided Fisher exact tests combined with a modified Fisher method). The ratios of N experiments are shown. (k) Quantification of touch-evoke flight response assay of MO1-control- or MO1-washc4-injected embryos at 60 hpf. n = 40, N = 3 (MO1-control), n = 40, N = 3 (MO1-washc4); data represent means.