- Title
-
Zebrafish Differentially Process Color across Visual Space to Match Natural Scenes
- Authors
- Zimmermann, M.J.Y., Nevala, N.E., Yoshimatsu, T., Osorio, D., Nilsson, D.E., Berens, P., Baden, T.
- Source
- Full text @ Curr. Biol.
|
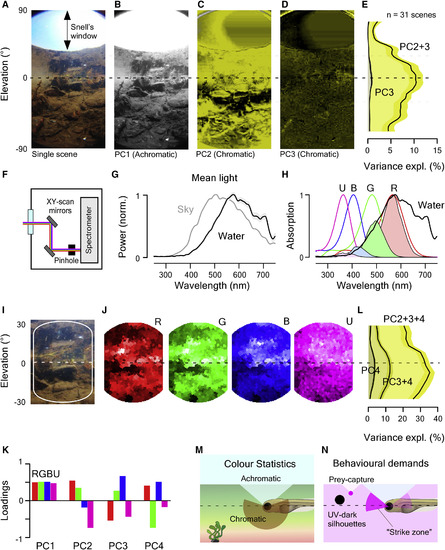
Distribution of Chromatic Content in the Zebrafish Natural Visual World (A) Example 180° underwater photograph taken in zebrafish-inhabited waters in West Bengal, India. (B?D) The first three principal components across the chromatic dimension (R, G, and B) of the image in (A). PC1 (B) reflects the achromatic image content, whereas PCs 2 (C) and 3 (D; false color coded in shades of yellow) reflect the remaining chromatic content. (E) Variance explained by PC3 and PC2+3 across all 31 images calculated from 5° horizontal images slices. Error shadings are in SD. (F) Schematic of the custom-built hyperspectral scanner. X and Y mirrors are moved through 1,000 regularly spaced positions over a 60° circular window to deflect a ?2.8° spot of light into a spectrometer and thereby build up a hyperspectral image [20]. (G) Mean of n = 31,000 peak-normalized underwater spectra (31 horizon-aligned scenes of 1,000 pixels each) and mean spectrum of the sky in zenith above the water. Shading is in SD. (H) Zebrafish opsin complement (B, blue, G, green; R, red; U, UV), which each opsin template multiplied with the mean underwater spectrum from (G) to estimate relative photon catch rates in nature. Templates are based on [3]; for discussion on spectral positions, see STAR Methods. (I and J) Enlargement (I) and reconstruction (J) of photographed scene (A) from scanner data by multiplying each pixel?s spectrum with each opsin template (H). Scan reconstructions are truncated beyond 20° from the center to remove sampling edge artifacts. (K) Mean loadings of PCs 1?4 across all n = 31 scans. (L) As (E), cumulative variance explained by PCs 2?4 calculated separately for 5° vertical slices across all n = 31 scanned scenes. Error shadings are in SD. As before (E), most chromatic information exists at and below the horizon. (M and N) Schematic summary of natural chromatic statistics (M) and of expected behaviorally important short-wavelength-specific visual requirements (N). Larval schematic is modified from L. Griffiths. See also Figure S1 and Data S1. |
|
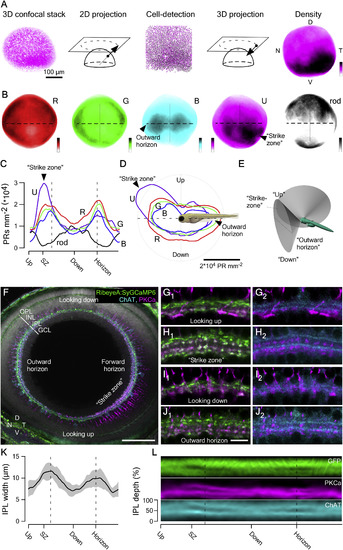
Anisotropic Retinal Structure (A) 3D confocal stack taken across the entire retina of an 8 dpf larva (Tg(Opn1sw1:GFP)) with all U-cones fluorescently labeled was used for semi-automated quantification of cone densities across the retina (STAR Methods). (B) Average densities of all four cone types and rods across the retina, based on n = 6 (R), 6 (G), 5 (B), 5 (U), and 4 (rods) retinas (Tg(thrb:Tomato) for R; zpr-1 antibody staining for G; Tg(?3.5opn1sw2:mCherry) for B; Tg(opn1sw1:GFP) for U; and Tg(xops:ntr-mCherry) for rod). Color scales: 0 (white)?35,000 (black) cones mm?2 or 0?9,000 rods mm?2. D, dorsal; N, nasal; T, temporal; V, ventral. (C?E) To compare cone distributions across retinal positions (C and D), we computed densities at sagittal plane approximately aligned with the back surface of the lens (E; STAR Methods). This plane projects in a ?130° cone from the eye center, with eyes rotated ?36.5° forward during prey capture (18.5° at rest; Figures S2A and S2B). Cone and rod densities across the plane are defined in (E) on a linear scale of the fish?s egocentric visual field. Dashed lines indicate the forward and outward horizon. (D) is as (C), plotted in polar coordinates relative to the body of the fish as indicated. (F) Whole-eye immunostaining of an 8 dpf Tg(?1.8ctbp2:SyGCaMP6) larvae labeled against GFP (bipolar cell [BC] terminals, green), choline acetyltransferase (ChAT) (cholinergic amacrine cells, cyan), and protein kinase C alpha (PKC?) (on-BCs, magenta). Shown is the same sagittal section used in (F)?(H). PKC?-stained BC somata are only faintly visible as the chosen equalization was tuned to highlight the much more strongly labeled synaptic terminals in the strike zone. The scale bar represents 50 ?m. GCL, ganglion cell layer; INL, inner nuclear layer; IPL, inner plexiform layer; OPL, outer plexiform layer. (G?J) Higher magnification sections from (F) showing the IPL at different positions across the eye as indicated. For clarity, GFP/PKC? (G1?J1) and ChAT/PKC? (G2?J2) are shown separately. Looking up (G), ?strike zone? (H), looking down (I), and outward horizon (J). The scale bar represents 5 ?m. (K) Mean IPL thickness across n = 5 whole-eye immunostainings as in (F). (L) Mean signal in the three fluorescence channels as above. See also Figure S2. |
|
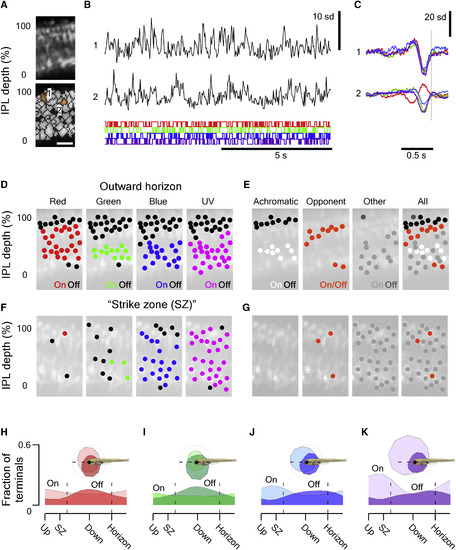
Surveying Inner Retinal Chromatic Responses In Vivo (A) 2-photon scan field (32 × 64 pixels; 15.625 Hz) of a nasal IPL section (outward horizon) in a Tg(?1.8ctbp2:SyGCaMP6) larvae for simultaneous recording of light-driven calcium responses across the entire IPL depth at single-terminal resolution (top) and regions of interest (ROIs) (bottom). The scale bar represents 5 ?m. (B) Example of calcium responses to tetrachromatic binary white noise stimulation (12.8 Hz; STAR Methods) of two ROIs highlighted in (A). (C) Tetrachromatic linear filters (?kernels?) recovered by reverse correlation of each ROI?s response with the noise stimulus (B). The color code indicates the stimulus channel (R, G, B, U; cf. Figure S3A). (D) For each stimulus channel, we classified each ROI?s kernel as either ?on? (in red, green, blue, or purple), ?off? (black), or non-responding (no marker) and plotted each response over the anatomical scan image (STAR Methods). (E) By comparison across the four stimulus channels, we then classified each ROI as either achromatic off (R+G+B+U off, black) or on (R+G+B+U on, white), Color opponent (any opposite polarity responses in a single ROI, orange) or ?other? (gray) and again plotted each ROI across the IPL to reveal clear chromatic and achromatic layering in this scan is shown. (F and G) As (D) and (E), respectively, but for a scan taken in the temporo-ventral retina, which surveys the world in front of the animal just above the visual horizon. This zone is critical for prey capture and was thus dubbed ?strike zone?. (H?K) Distribution of all on and off responses per stimulus channel (H, red; I, green; J, blue; and K, UV) based on n = 4,099/6,565 ROIs that passed a minimum quality criterion (STAR Methods) sampled from across the entire sagittal plane (115 scans, 12 fish). See also Figure S3. |
|
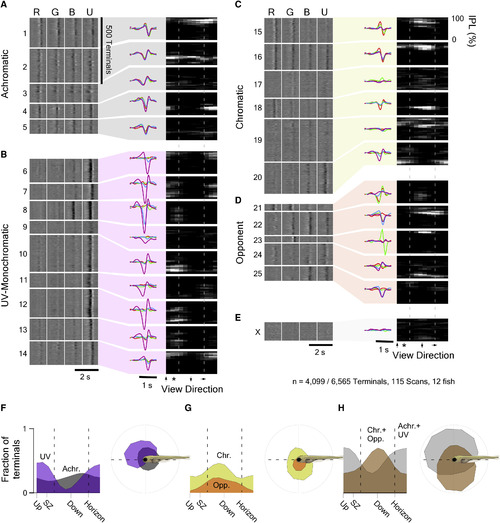
The Functional Organization of the Larval Zebrafish Eye Mixture of Gaussian clustering of all n = 4,099 responding terminals based on the full waveforms of their tetrachromatic kernels, with cluster number limited by the Bayesian Information Criterion (BIC), yielded 25 clusters (C1?25) and 1 discard cluster (CX). (A?D) For simplicity, each cluster was further allocated to one of four major response groups (STAR Methods): (A) achromatic (C1?5); (B) UV(B)-monochromatic (C6?14); (C) chromatic (C15?20); and (D) color opponent (C21?25). (E) Discard cluster Cx. For each cluster, shown are the time courses of each kernel (left heatmaps; lighter shades indicating higher values), the cluster means (middle), and their anatomical distribution across IPL depth (y axis) and position in the eye (x axis; right heatmaps; lighter shades indicate higher abundance). Dashed lines indicate the forward and outward horizon; the asterisk denotes the position of the strike zone. The height of each cluster?s left heatmap indicates its number of allocated terminals. (F?H) Linear (left) and polar (right) histograms of terminal abundance of the functional groups defined in (A)?(E) across the larval zebrafish?s visual space. (F) UV(B)-monochromatic (purple) and achromatic (gray) groups, (G) chromatic (yellow) and color-opponent (orange) groups, and (H) summed UV(B)-monochromatic and achromatic groups (gray) versus chromatic and color opponent groups (brown) are shown. |
|
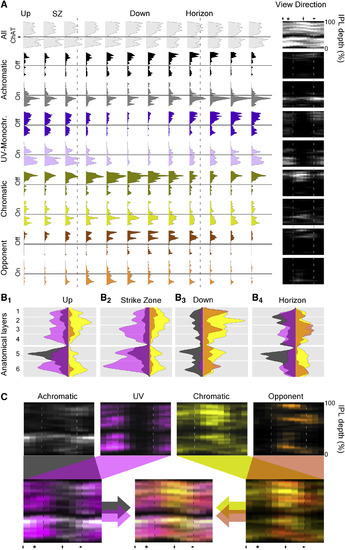
Distribution of Function across the IPL (A) Histograms of terminal abundance across IPL depth (y axis) and position in the eye (set of histograms) for each functional group (cf. Figure 7), divided by on- and off-dominated responses as indicated. In addition, the distribution of all n = 6,565 scanned terminals independent of response quality is plotted to reveal the anatomical distribution of all BC terminals (top, light gray). Heatmaps to the right show the same data in a single image. Asterisk denotes the position of the strike zone. Dashed lines indicate the forward and outward visual horizon. Solid horizontal lines indicate the position of the lower ChAT band as an anatomical reference. (B1?4) On and off-collapsed histograms of the four response groups for four example regions (down, dorsal; outward horizon, nasal as indicated; strike zone, temporo-ventral; up, ventral) summarize the functional IPL layering across eye positions, with approximate anatomical layers indicated in the background shading. For clarity, achromatic and UV(B)-monochromatic histograms are x axis reversed. (C) Color-coded response groups (top) plotted against eye position (x) and IPL depth (y) and merge (bottom). Throughout, colors indicate the functional groups: achromatic (gray and black); UV(B)-monochromatic (purple and violet); chromatic (yellow and beige); and color opponent (orange and brown). |
|
Distribution of xfz43-Expressing BC Types (A) High-resolution 2-photon scan of a ventro-nasal (up and outward) IPL section in 7 dpf larvae expressing SyGCaMP6f under ctbp2 promoter (green) as well as mCherry under xfz43 (red). The scale bar represents 5 ?m. (B) Subsequent higher rate scans during light stimulation allowed recovering tetrachromatic kernels from individual xfz43-positive terminals as before (right). (C) Distribution of 392/620 xfz43-positive BC terminals (64 scans, 5 fish) that passed our response criterion (red; STAR Methods) across the IPL (y) and eye (x), superimposed on the distribution of all terminals from the same scans (green). The heatmap on the right shows only xfz43-positive terminals. Dashed lines indicate the forward and outward horizon, whereas the solid horizontal line indicates the position of the lower ChAT band. (D) Allocation of all xfz43-positive anatomical off terminals to functional clusters (right) and distribution of these terminals across the eye by functional group (left). (E) As (D) but for xfz43-positive anatomical on cells. See also Figure S4. |
|
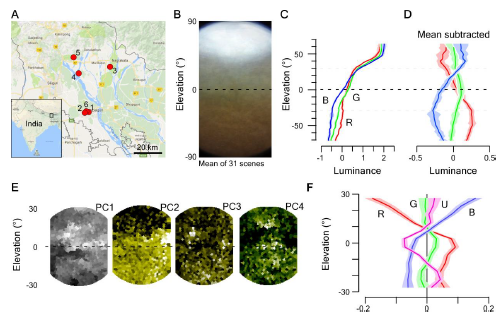
Distribution of chromatic content in the zebrafish natural visual world. Related to Figure 1. A, Location of field sites visited in West Bengal, India. B, Mean of n=31 action camera images and C, mean z-normalised brightness of the red, green and blue camera channels across these scenes. D, As (C), with mean between all 3 channels subtracted to highlight the differences between the three channels. Errors in C,D in s.e.m. E, Principal components 1-4 (left to right) of the hyperspectral example image shown in Figure 1J, (cf. Figure 1B-D). F, Achromatic-mean-subtracted mean luminance of the 4 opsin channels from the same scene (like in D). Errors in s.e.m.. |
|
Anisotropic retinal structure. Related to Figure 2. A, Transverse plane (looking down onto the fish from the top) immunolabelled 7 dpf larval zebrafish eye with bipolar cell terminals in green (like Figure 2L) highlights the ~130° visual angle surveyed by the sagittal plane used throughout this work (indicated in red). B, 3D illustrations of the field of view covered by this sagittal plane during ?rest? (eyes tilted forward ~18.5°) and during prey-capture (?hunting?, eyes at 35.5°) as indicated. In the top left panel, the ~163° full field of view of the eye is indicated in addition to the 130° field surveyed in this work. |

