
|
Fig. 6
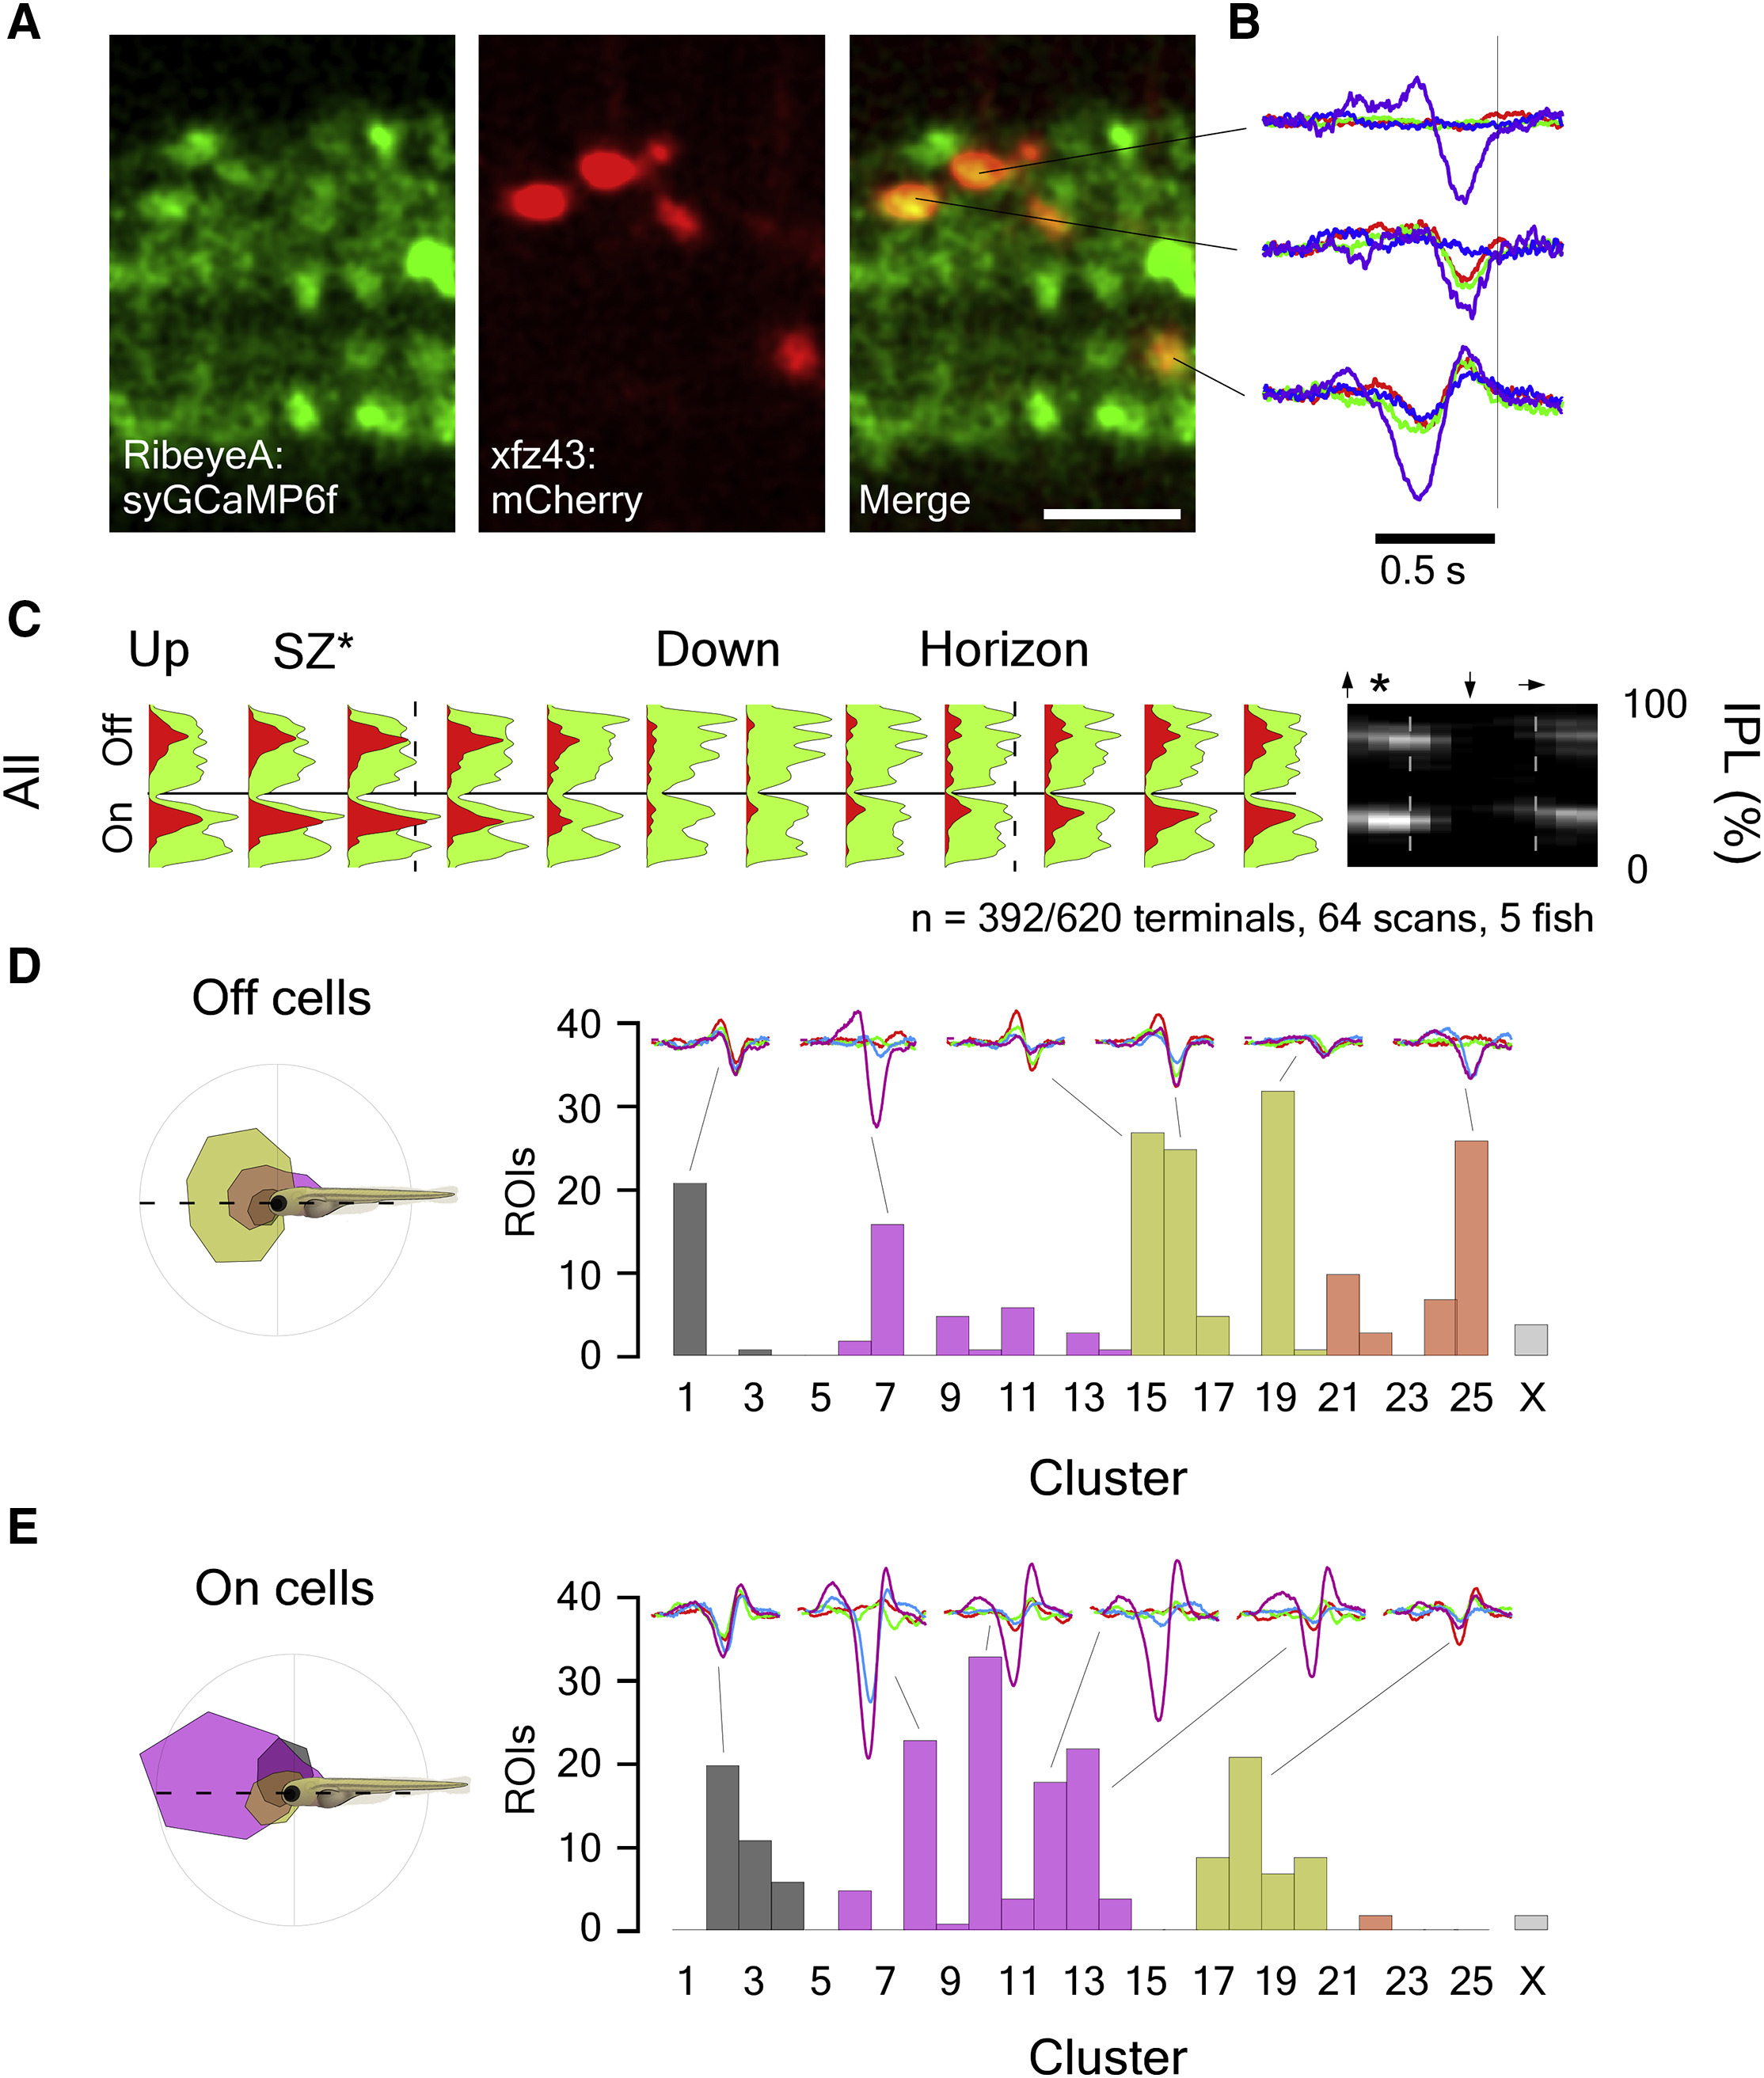
Distribution of xfz43-Expressing BC Types
(A) High-resolution 2-photon scan of a ventro-nasal (up and outward) IPL section in 7 dpf larvae expressing SyGCaMP6f under ctbp2 promoter (green) as well as mCherry under xfz43 (red). The scale bar represents 5 ?m.
(B) Subsequent higher rate scans during light stimulation allowed recovering tetrachromatic kernels from individual xfz43-positive terminals as before (right).
(C) Distribution of 392/620 xfz43-positive BC terminals (64 scans, 5 fish) that passed our response criterion (red; STAR Methods) across the IPL (y) and eye (x), superimposed on the distribution of all terminals from the same scans (green). The heatmap on the right shows only xfz43-positive terminals. Dashed lines indicate the forward and outward horizon, whereas the solid horizontal line indicates the position of the lower ChAT band.
(D) Allocation of all xfz43-positive anatomical off terminals to functional clusters (right) and distribution of these terminals across the eye by functional group (left).
(E) As (D) but for xfz43-positive anatomical on cells.
See also Figure S4.