
|
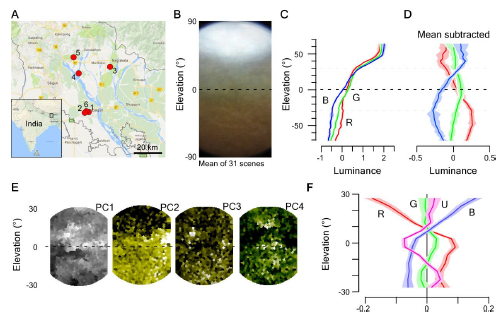
Fig. S1
Distribution of chromatic content in the zebrafish natural visual world. Related to Figure 1. A, Location of field sites visited in West Bengal, India. B, Mean of n=31 action camera images and C, mean z-normalised brightness of the red, green and blue camera channels across these scenes. D, As (C), with mean between all 3 channels subtracted to highlight the differences between the three channels. Errors in C,D in s.e.m. E, Principal components 1-4 (left to right) of the hyperspectral example image shown in Figure 1J, (cf. Figure 1B-D). F, Achromatic-mean-subtracted mean luminance of the 4 opsin channels from the same scene (like in D). Errors in s.e.m..