Fig. 1
Distribution of Chromatic Content in the Zebrafish Natural Visual World
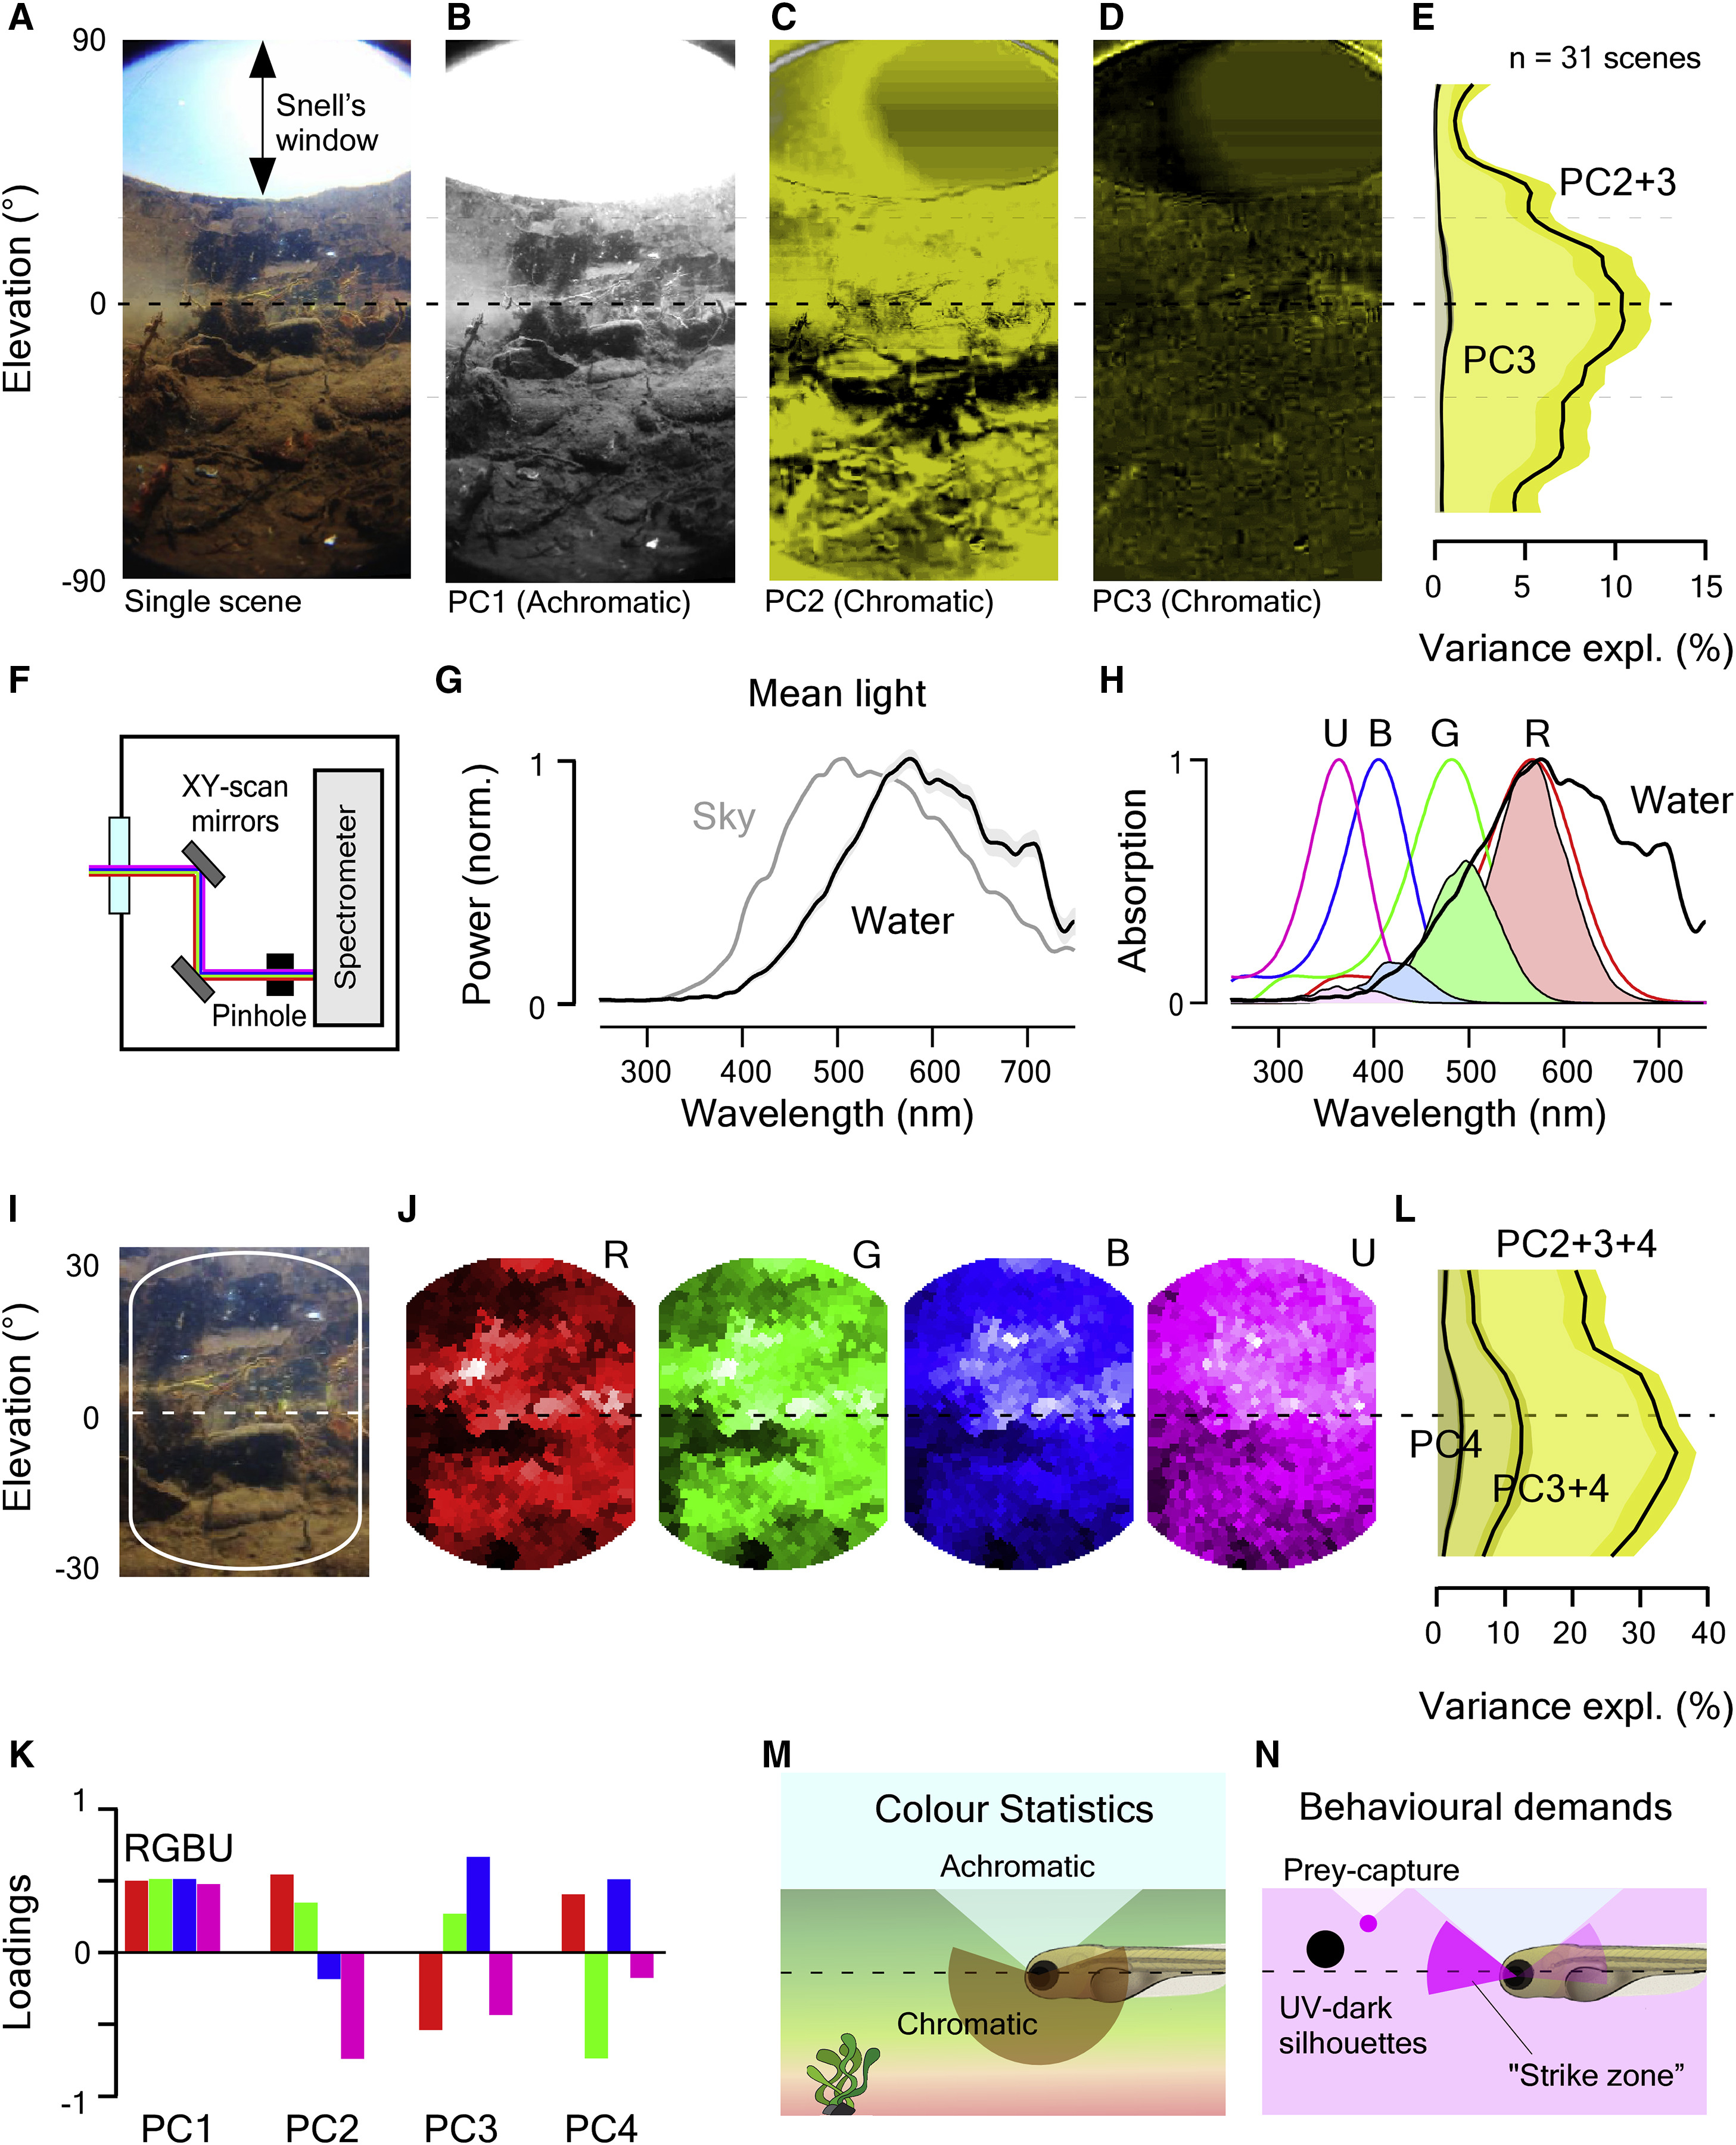
(A) Example 180° underwater photograph taken in zebrafish-inhabited waters in West Bengal, India.
(B?D) The first three principal components across the chromatic dimension (R, G, and B) of the image in (A). PC1 (B) reflects the achromatic image content, whereas PCs 2 (C) and 3 (D; false color coded in shades of yellow) reflect the remaining chromatic content.
(E) Variance explained by PC3 and PC2+3 across all 31 images calculated from 5° horizontal images slices. Error shadings are in SD.
(F) Schematic of the custom-built hyperspectral scanner. X and Y mirrors are moved through 1,000 regularly spaced positions over a 60° circular window to deflect a ?2.8° spot of light into a spectrometer and thereby build up a hyperspectral image [20].
(G) Mean of n = 31,000 peak-normalized underwater spectra (31 horizon-aligned scenes of 1,000 pixels each) and mean spectrum of the sky in zenith above the water. Shading is in SD.
(H) Zebrafish opsin complement (B, blue, G, green; R, red; U, UV), which each opsin template multiplied with the mean underwater spectrum from (G) to estimate relative photon catch rates in nature. Templates are based on [3]; for discussion on spectral positions, see STAR Methods.
(I and J) Enlargement (I) and reconstruction (J) of photographed scene (A) from scanner data by multiplying each pixel?s spectrum with each opsin template (H). Scan reconstructions are truncated beyond 20° from the center to remove sampling edge artifacts.
(K) Mean loadings of PCs 1?4 across all n = 31 scans.
(L) As (E), cumulative variance explained by PCs 2?4 calculated separately for 5° vertical slices across all n = 31 scanned scenes. Error shadings are in SD. As before (E), most chromatic information exists at and below the horizon.
(M and N) Schematic summary of natural chromatic statistics (M) and of expected behaviorally important short-wavelength-specific visual requirements (N). Larval schematic is modified from L. Griffiths.
See also Figure S1 and Data S1.

