
Fig. 4
- ID
- ZDB-FIG-181030-43
- Publication
- Zimmermann et al., 2018 - Zebrafish Differentially Process Color across Visual Space to Match Natural Scenes
- Other Figures
- All Figure Page
- Back to All Figure Page
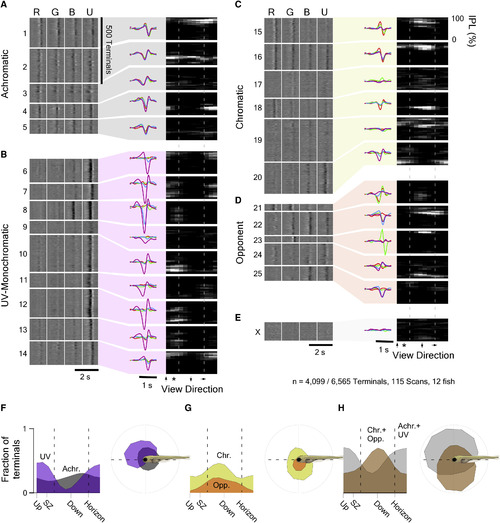
The Functional Organization of the Larval Zebrafish Eye Mixture of Gaussian clustering of all n = 4,099 responding terminals based on the full waveforms of their tetrachromatic kernels, with cluster number limited by the Bayesian Information Criterion (BIC), yielded 25 clusters (C1?25) and 1 discard cluster (CX). (A?D) For simplicity, each cluster was further allocated to one of four major response groups (STAR Methods): (A) achromatic (C1?5); (B) UV(B)-monochromatic (C6?14); (C) chromatic (C15?20); and (D) color opponent (C21?25). (E) Discard cluster Cx. For each cluster, shown are the time courses of each kernel (left heatmaps; lighter shades indicating higher values), the cluster means (middle), and their anatomical distribution across IPL depth (y axis) and position in the eye (x axis; right heatmaps; lighter shades indicate higher abundance). Dashed lines indicate the forward and outward horizon; the asterisk denotes the position of the strike zone. The height of each cluster?s left heatmap indicates its number of allocated terminals. (F?H) Linear (left) and polar (right) histograms of terminal abundance of the functional groups defined in (A)?(E) across the larval zebrafish?s visual space. (F) UV(B)-monochromatic (purple) and achromatic (gray) groups, (G) chromatic (yellow) and color-opponent (orange) groups, and (H) summed UV(B)-monochromatic and achromatic groups (gray) versus chromatic and color opponent groups (brown) are shown. |