- Title
-
Spatially Resolved Genome-wide Transcriptional Profiling Identifies BMP Signaling as Essential Regulator of Zebrafish Cardiomyocyte Regeneration
- Authors
- Wu, C.C., Kruse, F., Vasudevarao, M.D., Junker, J.P., Zebrowski, D.C., Fischer, K., Noël, E.S., Grün, D., Berezikov, E., Engel, F.B., van Oudenaarden, A., Weidinger, G., Bakkers, J.
- Source
- Full text @ Dev. Cell
|
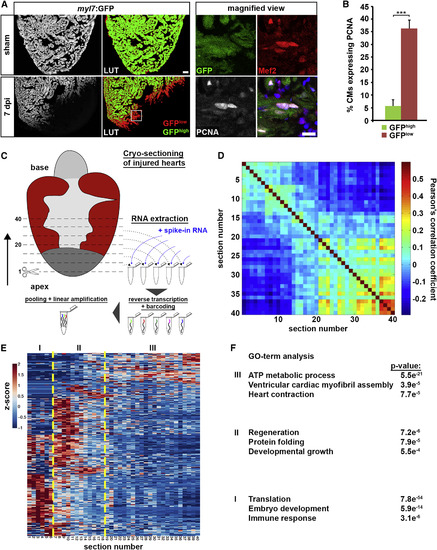
Tomo-Seq Identifies Genes with Spatially Restricted Expression in the Regenerating Heart (A) Ventricular myl7:GFP expression is reduced at the wound border at 7 days post cryoinjury (dpi). In LUT (lookup table) images, GFP intensity below a threshold of 30% of signal intensity is displayed in red (GFPlow) while the rest is displayed in green (GFPhigh). Boxed area is presented as magnified view,which shows examples of Mef2+, GFPlow cardiomyocytes expressing PCNA. Scale bars, 50 µm (overview) and 25 µm (magnified view). (B) Average percentage of PCNA expressing GFPlow and GFPhigh cardiomyocytes. Error bars represent SEM. Student?s t test, ***p = 0.0003. (C) Cartoon summarizing the tomo-seq procedure. Cryoinjured zebrafish ventricles were sectioned from apex to base. RNA from single sections was extracted, followed by reverse transcription and barcoding, after which the samples were pooled for linear amplification and sequence library preparation. (D) Pairwise correlation between individual sections across all genes detected at more than four reads in more than one section of the 3 dpi heart. (E) Hierarchical clustering of Z score transformed expression profiles of all genes with expression peak (Z score > 1 in > 4 consecutive sections) in the 3 dpi heart. Zones I to III are marked by dashed yellow lines. (F) Results of GO-term analysis using GOrilla for genes with spatially restricted expression in zones I, II, and III (based on gene lists in Data S2, S3, and S4) in the 3 dpi heart. |
|
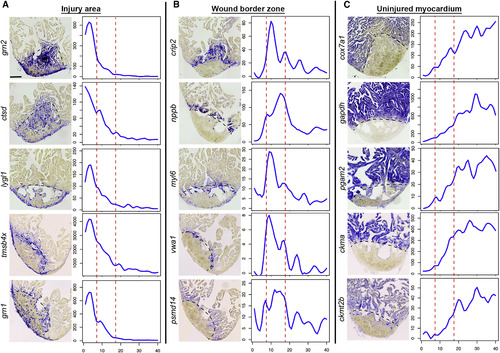
In Situ Hybridization Validates Tomo-Seq Results In situ hybridization for genes identified by tomo-seq to be enriched in the injury area (zone I) (A), wound border zone (zone II) (B), or the uninjured myocardium (zone III) (C) at 3 dpi (n = 3). Left: representative in situ staining; right: expression traces from tomo-seq data. y axis, read counts; x axis, section number. Scale bar, 100 µm. Dashed black line indicates wound boundary on sections. Red lines in plots surround the border zone. |
|
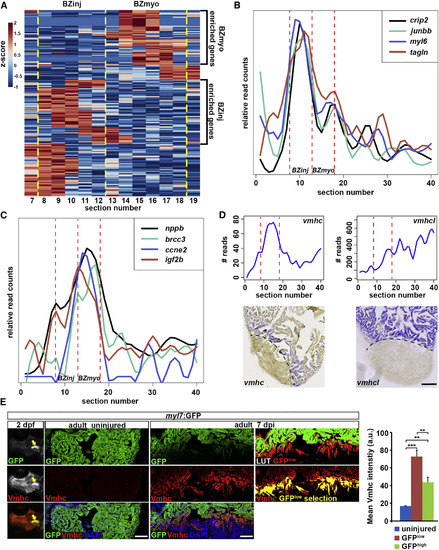
The Wound Border Zone Can Be Subdivided Based on Distinct Expression Profiles (A) Cluster analysis on all genes with expression peaks in greater than three consecutive sections in the border zone (sections 8?18) of the 3 dpi heart identifies two sub-regions showing different expression patterns. Color spectrum indicates Z score. BZinj and BZmyo are marked by dashed yellow lines. (B) Expression traces from tomo-seq data on cryoinjured heart (3 dpi) for selected genes showing peak expression in the BZinj region. (C) Expression traces from tomo-seq data on cryoinjured heart (3 dpi) for selected genes showing peak expression in the BZmyo region. (D) Expression traces from tomo-seq data and in situ hybridization on cryoinjured heart (3 dpi) for the myosin heavy chain (MHC) genes vmhc and vmhc-like (vmhcl). Scale bar, 100 µm. (E) Ventricular myosin heavy chain (Vmhc) expression is detected in the developing heart of myl7:GFP transgenic embryos at 2 days post fertilization (arrow), but not in uninjured adult hearts. Vmhc is again expressed in GFPlow cardiomyocytes at 7 dpi. In LUT (lookup table) images, GFP intensity below 30% of signal intensity is displayed in red (GFPlow) while the rest is displayed in green (GFPhigh). Note the overlapping expression pattern between GFPlow area (depicted as GFPlow selection) and Vmhc. Average Vmhc signal intensity in uninjured, GFPlow, and GFPhigh cardiomyocytes at 7 dpi is plotted on the right. Error bars represent SEM. Student?s t test, ***p = 0.0008 (uninjured versus GFPlow), **p = 0.002 (uninjured versus GFPhigh), **p = 0.004 (GFPlow versus GFPhigh). Scale bar, 50 µm. |
|
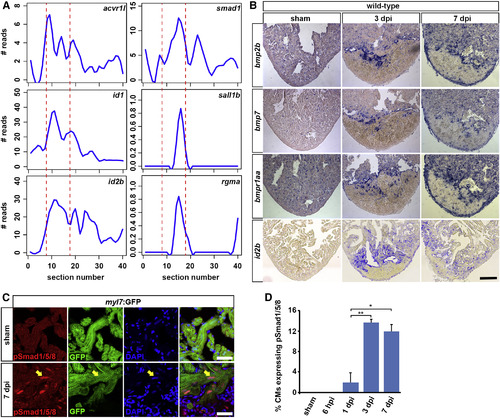
BMP Signaling Is Activated in Border Zone Cardiomyocytes (A) Expression traces from tomo-seq data on cryoinjured heart (3 dpi) for BMP signaling-related genes reveal peak expression in the wound border zone (indicated by dashed lines). (B) In situ hybridizations on sham-operated and 3 and 7 dpi hearts for the BMP ligands bmp2b and bmp7, the BMP receptor bmpr1aa (alk3a), and the BMP target gene id2b. Scale bar, 100 µm. (C) At 7 dpi, nuclear pSmad1/5/8 expression (arrow) is detected in myl7:GFP-positive cardiomyocytes at the wound border. Scale bar, 25 µm. (D) Average percentage of cardiomyocytes at the wound border expressing nuclear pSmad1/5/8 at different time points after cryoinjury. Error bars represent SEM. Student?s t test, *p = 0.011, **p = 0.004. |
|
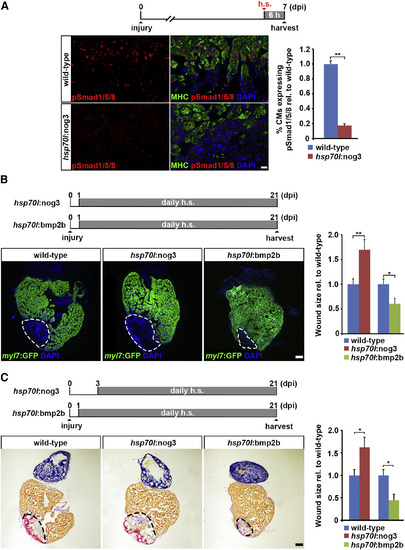
BMP Signaling Is Required for Myocardial Regeneration and Is Sufficient to Enhance It (A) Expression of noggin3 in hsp70l:nog3 transgenics for 6 hr is sufficient to significantly reduce nuclear pSmad1/5/8 accumulation in cardiomyocytes (CMs; positive for myosin heavy chain, MHC) at the wound border at 7 dpi. h.s., heat shock. Average percentage of cardiomyocytes expressing pSmad1/5/8 relative to that in wild-type hearts is plotted. Error bars represent SEM. Student?s t test, **p = 0.003. Scale bar, 25 µm. (B) GFP immunofluorescence analysis reveals wound size (dashed lines) at 21 dpi on heart sections of hsp70l:nog3; myl7:GFP, and hsp70l:bmp2b; myl7:GFP double transgenics and their respective myl7:GFP-only siblings (labelled ?wild-type?) subjected to the depicted heat-shock regime. Size of the GFP-negative area relative to the whole ventricle and normalized to heat-shocked myl7:GFP-only siblings is plotted. Error bars represent SEM. Student?s t test, **p = 0.0081 (nog3), *p = 0.018 (bmp2b). Scale bar, 100 µm. (C) Acid fuchsin orange G (AFOG) staining reveals wound size (dashed lines) at 21 dpi on heart sections of hsp70l:nog3, hsp70l:bmp2b transgenics and wild-type siblings subjected to the depicted heat-shock regime. Size of the wound tissue (red and purple staining) relative to the whole ventricle and normalized to heat-shocked wild-type siblings is plotted on the right. Error bars represent SEM. Student?s t test, *p = 0.002 (nog3), *p = 0.016 (bmp2b). Scale bar, 100 µm. |
|
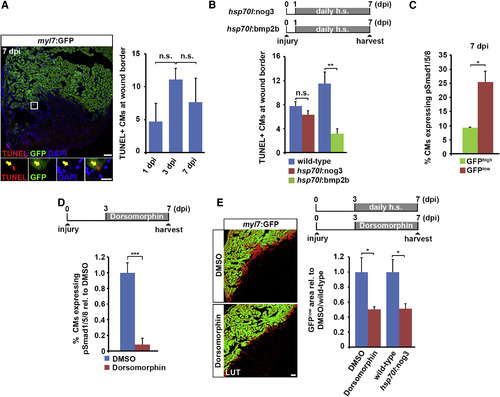
BMP Signaling Is Required for Cardiomyocyte Dedifferentiation but Not Survival (A) TUNEL staining on sections of myl7:GFP hearts at 7 dpi. Magnified view (boxed area) shows an example of an apoptotic cardiomyocyte (yellow arrow). Average absolute number of TUNEL+ cardiomyocytes per section found at the wound border at different time points post injury is plotted. Error bars represent SEM. Student?s t test, not significant (n.s.), p = 0.13 (1 versus 3 dpi), p = 0.45 (3 versus 7 dpi). Scale bars, 50 µm (overview), 12.5 µm (inset). (B) The number of TUNEL+ cardiomyocytes at the wound border at 7 dpi does not significantly change in hsp70l:nog3 transgenics relative to heat-shocked wild-type siblings, while it is reduced in hsp70l:bmp2b transgenics. Error bars represent SEM. Student?s t test, p = 0.38 (nog3) (not significant), **p = 0.004 (bmp2b). Scale bars, 50 µm (overview), 12.5 µm (inset). (C) Average percentage of pSmad1/5/8 expressing GFPlow and GFPhigh cardiomyocytes in myl7:GFP transgenic hearts at 7 dpi. Error bars represent SEM. Student?s t test, *p = 0.014. (D) Treatment of myl7:GFP transgenic fish with 5 µM dorsomorphin for 4 days significantly reduces nuclear pSmad1/5/8 accumulation in cardiomyocytes at the wound border at 7 dpi. Average percentage of cardiomyocytes expressing pSmad1/5/8 relative to DMSO control is plotted. Error bar represents SEM. Student?s t test, ***p = 0.0002. (E) Cardiomyocyte dedifferentiation, as monitored by the size of the GFPlow area in myl7:GFP transgenic hearts at 7 dpi, is reduced upon BMP signaling inhibition either by treatment with 5 µM dorsomorphin or by noggin3 overexpression for 4 days. Error bars represent SEM. Student?s t test, *p = 0.013 (dorsomorphin), *p = 0.025 (nog3). Scale bar, 50 µm. |
|
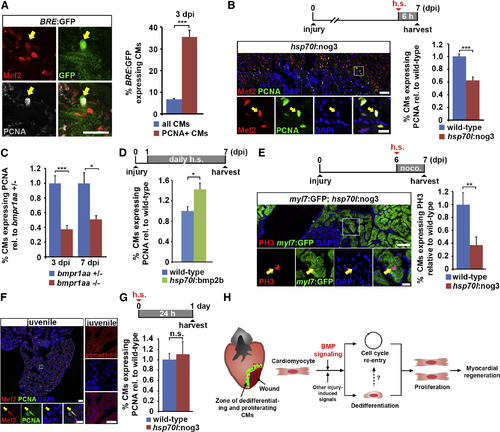
BMP Signaling is Required for Injury-Induced but Not Physiological Cardiomyocyte Proliferation (A) Co-localization of Mef2 and PCNA with GFP (arrow), which reports BMP-mediated transcriptional activity in BRE:GFP transgenic hearts, at 3 dpi. Average percentages of PCNA+ and of all cardiomyocytes that express GFP are plotted. Error bars represent SEM. Student?s t test, ***p = 0.000023. (B) Expression of noggin3 in hsp70l:nog3 transgenics for 6 hr is sufficient to reduce PCNA expression in cardiomyocytes (identified by nuclear Mef2, arrow) at the wound border at 7 dpi. Boxed area is shown as magnified view. Average percentage of cardiomyocytes expressing PCNA relative to wild-type is plotted. Error bars represent SEM. Student?s t test, ***p = 0.00095. Scale bar, 50 µm. (C) Hearts homozygous for a loss-of-function mutation of the BMP type-I receptor bmpr1aa display reduced expression of PCNA in cardiomyocytes (identified by nuclear Mef2) at the wound border at 3 and 7 dpi compared with bmpr1aa+/- hearts. Average percentage of cardiomyocytes expressing PCNA relative to bmpr1aa+/- control is plotted. Error bars represent SEM. Student?s t test, ***p = 0.0002 (3 dpi), *p = 0.01 (7 dpi). (D) Overexpression of bmp2b for 6 days via daily heat shock is sufficient to increase PCNA expression in cardiomyocytes at the wound border in hsp70l:bmp2b transgenics relative to heat-shocked wild-type siblings at 7 dpi. Average percentage of cardiomyocytes expressing PCNA relative to wild-type is plotted. Error bars represent SEM. Student?s t test, *p = 0.011. (E) Expression of noggin3 for 24 hr in hsp70l:nog3; myl7:GFP double transgenics that were treated with 5 µM nocodazole reduces the percentage of phospho-Histone 3 (PH3)+ mitotic cardiomyocytes (arrow). Boxed area is shown as magnified view. Average percentage of cardiomyocytes expressing PH3 relative to wild-type is plotted. Error bars represent SEM. Student?s t test, **p = 0.0068. Scale bar, 50 µm (overview) and 25 µm (magnified view). (F) Many Mef2+ cardiomyocytes are also PCNA+ (arrow) in 9-week-old juvenile fish hearts, but no nuclear pSmad1/5/8 can be detected. Boxed area is shown as magnified view. Scale bar, 50 µm (overview and magnified view on the left) and 25 µm (pSmad1/5/8 staining on the right). (G) Expression of noggin3 in juvenile hsp70l:nog3 transgenics for 24 hr does not reduce the expression of PCNA in cardiomyocytes. Average percentage of cardiomyocytes expressing PCNA relative to wild-type is plotted. Error bars represent SEM. Student?s t test, p = 0.67 (not significant). (H) Model for BMP function during zebrafish heart regeneration. BMP signaling is activated in cardiomyocytes at the wound border and is required for cellular responses to injury in these cells, namely dedifferentiation and cell-cycle re-entry, and thus for cardiomyocyte proliferation and myocardial regeneration. |
|
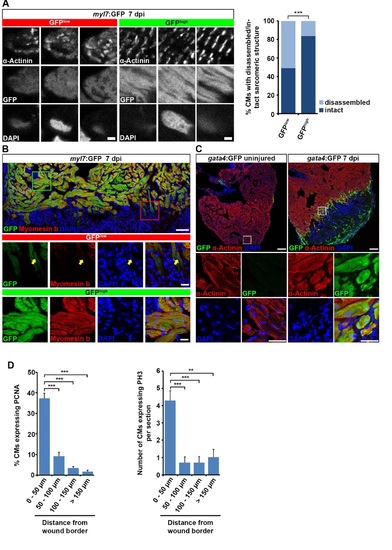
Cardiomyocytes at the wound border dedifferentiate and re-enter the cell cycle. Related to Figure 1. (A) Individual GFPlow and GFPhigh cardiomyocytes were randomly picked on sections of myl7:GFP transgenic hearts and their sarcomeric structure was categorized according to α-Actinin protein arrangement. Striated and disorganized pattern of α-Actinin protein expression was categorized as intact and disassembled sarcomeric structure, respectively. A higher fraction of GFPlow cardiomyocytes display disassembled sarcomeric structures than GFPhigh cardiomyocytes at 7 dpi. Scale bar, 12.5 µm. Fisher?s exact test, p = 0.0002. (B) GFPlow cardiomyocytes show reduced Myomesin b expression (arrow) in myl7:GFP transgenic hearts at 7 dpi. Scale bar, 50 µm (overview) and 25 µm (inset). (C) GFP expression in gata4:GFP transgenic hearts is activated in α-Actinin+ cardiomyocytes at the wound border at 7 dpi. Scale bar, 50 µm (overview) and 12.5 µm (inset). (D) Proliferating cardiomyocytes, as revealed by PCNA and PH3 expression, are mainly localized within 50 µm of the wound border. Average percentage of PCNA and average number of PH3 positive cardiomyocytes at various distances from the wound border is plotted. Error bars represent SEM. Student?s t test, PCNA: p = 0.00002 (0 ? 50 µm vs 50 ? 100 µm), p = 0.000001 (0 ? 50 µm vs 100 ? 150 µm), p = 0.0000008 (0 ? 50 µm vs >150 µm); PH3: p = 0.0006 (0 ? 50 µm vs 50 ? 100 µm), p = 0.0006 (0 ? 50 µm vs 100 ? 150 µm), p = 0.0019 (0 ? 50 µm vs >150 µm). |
|
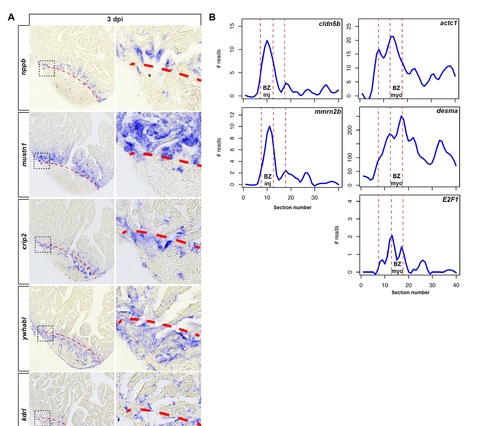
Spatially restricted gene expression reveals two distinct border zone regions. Related to Figure 3. (A) In situ hybridization on consecutive heart sections (3 dpi) for genes identified by Tomo-seq to be upregulated in the BZmyo (nppb and mustn1) and BZinj (crip2 and ywhabl). Expression of crip2 and ywhabl overlapped with kdrl, a marker for endothelial cells. Scale bar, 50 µm. Dashed red line outlines the injury area. (B) Expression traces from tomo-seq data (3 dpi) for genes involved in embryonic vascular endothelium development (cldn5b and mmrn2b), myocardial development (actc1 and desma) and cell cycle control (E2F1). |
|
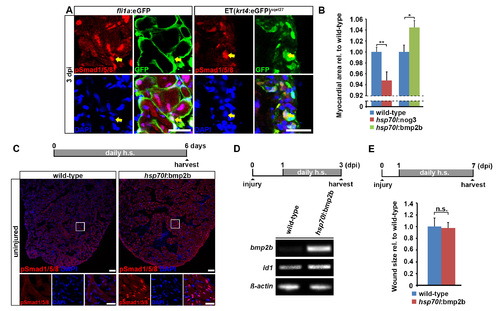
MP signaling is activated in endocardial and epicardial cells after injury and transgenic overexpression of bmp2b is sufficient to induce accumulation of nuclear pSmad1/5/8 and expression of the BMP target gene id1. Related to Figure 4. (A) BMP signaling, as revealed by expression of nuclear pSmad1/5/8, is activated in endocardial cells (marked by fli1a:eGFP expression, arrow) and epicardial cells (marked by ET(krt4:eGFP) expression, arrow) at 3 dpi. Scale bar, 25 µm. (B) At 21 dpi, hsp70l:nog3; myl7:GFP double transgenic fish heat-shocked using the same regime as shown in Figure 5B display a smaller area of ventricular myocardial tissue (positive for myl7:GFP) than heat-shocked myl7:GFP-only siblings. In contrast, hsp70l:bmp2b; myl7:GFP double transgenics contain more myocardial tissue than myl7:GFP-only controls. Size of the myocardial tissue relative to the whole ventricle normalized to myl7:GFP-only siblings is plotted. Error bars represent SEM. Student?s t test, p = 0.0081 (nog3), p = 0.018 (bmp2b). (C) Overexpression of bmp2b for 6 days via daily heat-shock is sufficient to induce expression of nuclear pSmad1/5/8 in uninjured hsp70l:bmp2b transgenic hearts but not in heat-shocked wild-type hearts. Scale bar, 50 µm. (D) RT-PCR reveals that overexpression of bmp2b for 2 days via daily heat-shock is sufficient to enhance the expression of bmp2b and id1, a conserved BMP target gene, in hsp70l:bmp2b transgenic hearts compared to heat-shocked wild-type siblings at 3 dpi. β-actin serves as loading control. (E) hsp70l:bmp2b transgenic hearts and respective wild-type siblings heat-shocked daily for 6 days do not show different wound sizes at 7 dpi. Error bars represent SEM. Student?s t test, p = 0.9. |
|
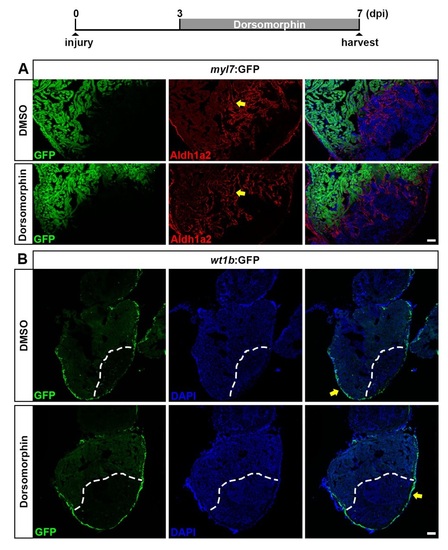
BMP signaling inhibition does not interfere with re-activation of aldhla2 and wt1b in the endocardium and epicardium. Related to Figure 6. (A) Treatment of myl7:GFP transgenic fish with 5 µM Dorsomorphin for 4 days does not interfere with expression of Aldh1a2 in endocardial cells (arrow) at 7 dpi. Scale bar, 50 µm. (B) Treatment of wt1b:GFP transgenic fish with 5 µM Dorsomorphin for 4 days does not interfere with epicardial expression of GFP (arrow) at 7 dpi. Dashed lines, wound boundary. Scale bar, 100 µm. |
|
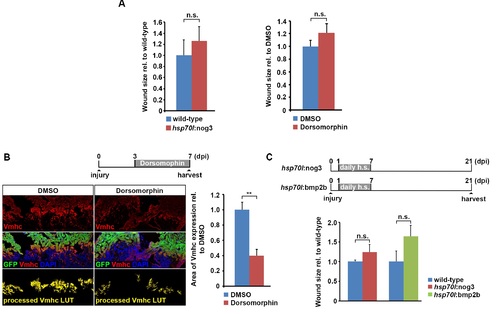
Inhibition of BMP signaling interferes with loss of cardiomyocyte differentiation markers and re-expression of a fetal form of myosin heavy chain. Related to Figure 6. (A) Inhibition of BMP signaling either by treatment with 5 µM Dorsomorphin in myl7:GFP transgenic hearts or by noggin3 overexpression for 4 days in myl7:GFP; hsp70l:nog3 double transgenic hearts does not alter wound size (the ventricular area lacking GFP expression) at 7 dpi. Error bars represent SEM. Student?s t test, p = 0.49 (wild-type vs hsp70l:nog3), p = 0.23 (DMSO vs Dorsomorphin). (B) Treatment of myl7:GFP transgenic fish with 5 µM Dorsomorphin for 4 days reduces the area of ventricular myosin heavy chain (Vmhc) expression in cardiomyocytes at 7 dpi. In processed Vmhc LUT images, all Vmhc signal with pixel intensity lower than 65 (8-bit image) were considered background. Error bars represent SEM. Scale bar, 50 µm. Student?s t test, p = 0.006. (C) Immunofluorescence analysis reveals wound size at 21 dpi on heart sections of hsp70l:nog3; myl7:GFP (GFP+) and hsp70l:bmp2b (positive for myosin heavy chain staining) transgenics and their respective wild-type siblings subjected to the depicted heat-shock regime. Size of the wound tissue relative to the whole ventricle normalized to wild-type siblings is plotted. Error bars represent SEM. Student?s t test, p = 0.25 (nog3), p = 0.14 (bmp2b). |
|
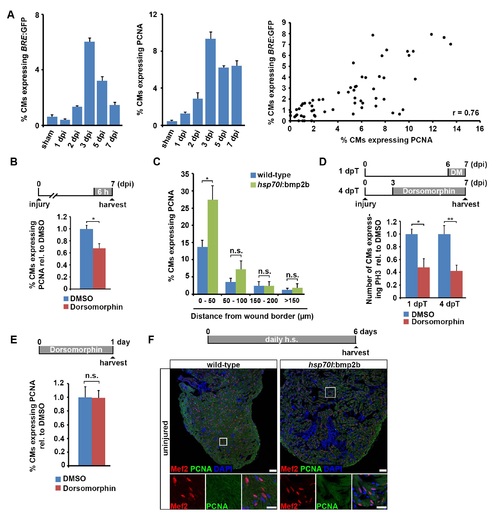
BMP signaling is required for cardiomyocyte cell cycle re-entry. Related to Figure 7. (A) BMP signaling activation, as revealed by BRE:GFP expression, positively correlates with PCNA expression in cardiomyocytes. Average percentage of cardiomyocytes expressing BRE:GFP and PCNA in sham and injured hearts at 1, 2, 3, 5 and 7 dpi is plotted. Percentage of cardiomyocytes expressing BRE:GFP is then plotted against percentage of cardiomyocytes expressing PCNA to determine the Pearson′s correlation coefficient (r = 0.76). Each data point represents one analyzed section. (B) Treatment of wild-type fish with 5 µM Dorsomorphin for 6 h reduces the expression of PCNA in cardiomyocytes at 7 dpi. Average percentage of cardiomyocytes expressing PCNA relative to DMSO control is plotted. Error bars represent SEM. Student?s t test, p = 0.015. (C) Overexpression of bmp2b for 6 days via daily heat-shock increases the expression of PCNA in cardiomyocytes within 50 µm of the wound border, but not further away, in hsp70l:bmp2b transgenics relative to heat-shocked wild-type siblings at 7 dpi. Average percentage of cardiomyocytes expressing PCNA at different distances from the wound border is plotted. Error bars represent SEM. Student?s t test, *, p = 0.02 (0 - 50 µm), p = 0.25 (50 ? 100 µm), p = 0.98 (100 ? 150 µm), p = 0.66 (> 150µm). (D) Treatment of myl7:GFP transgenic fish with 5 µM Dorsomorphin for 1 or 4 days reduces the number of phospho-Histone 3 (PH3)+ mitotic cardiomyocytes. Average number of cardiomyocytes expressing PH3 relative to DMSO control is plotted. Error bars represent SEM. Student?s t test, p = 0.028 (1 dpT), p = 0.0014 (4 dpT). (E) In juvenile fish, treatment with 5 µM Dorsomorphin for 24 h does not reduce the expression of PCNA in cardiomyocytes. Average percentage of cardiomyocytes expressing PCNA relative to wildtype is plotted. Error bars represent SEM. Student?s t test, p = 0.96. (F) Overexpression of bmp2b for 6 days via daily heat-shock is not able to induce expression of PCNA in cardiomyocytes in uninjured hsp70l:bmp2b transgenic hearts. Scale bar, 50 µm. |
Reprinted from Developmental Cell, 36(1), Wu, C.C., Kruse, F., Vasudevarao, M.D., Junker, J.P., Zebrowski, D.C., Fischer, K., Noël, E.S., Grün, D., Berezikov, E., Engel, F.B., van Oudenaarden, A., Weidinger, G., Bakkers, J., Spatially Resolved Genome-wide Transcriptional Profiling Identifies BMP Signaling as Essential Regulator of Zebrafish Cardiomyocyte Regeneration, 36-49, Copyright (2016) with permission from Elsevier. Full text @ Dev. Cell

