- Title
-
Zebrafish Bone and General Physiology Are Differently Affected by Hormones or Changes in Gravity
- Authors
- Aceto, J., Nourizadeh-Lillabadi, R., Marée, R., Dardenne, N., Jeanray, N., Wehenkel, L., Aleström, P., van Loon, J.J., Muller, M.
- Source
- Full text @ PLoS One
|
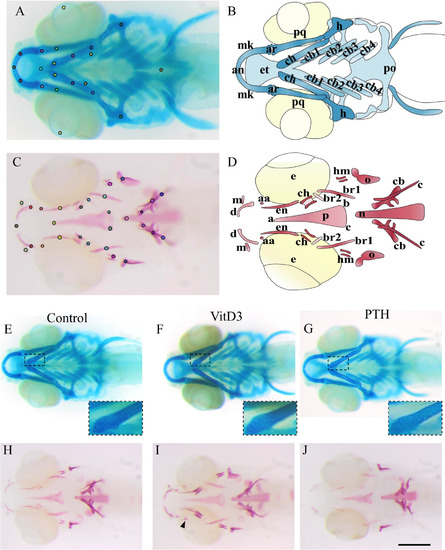
(A-D) Cartilage and bone elements of the head skeleton in 10dpf zebrafish. (A) Alcian blue staining of head cartilage representing the landmarks used for morphometry. (B) Schematic representation of the different head cartilage elements. anterior limit (an), articulation (ar), ceratobranchial pairs 1 to 4 (cb1-4), ceratohyal (ch), ethmoid plate (et), hyosymplectic (h), Meckel′s cartilage (mk), palatoquadrate (pq), posterior limit (po). (C) Alizarin red staining of cranial bones representing the landmarks used for morphometry. (D) Schematic representation of the different cranial bone elements with 29 landmarks used for chemicals treatments and 15 landmarks for the 3g and the relative-hypergravity. The 15 landmarks are anguloarticular (aa), anterior (an), branchiostegal ray1 (br1), entopterygoid (en), maxilla (m), notochord (n), opercle (o), parasphenoid (p). Note that the parasphenoid is a triangular bone defined by its anterior summit (a) and two posterior summits (b,c). The 29 landmarks include the 15 named before with branchiostegal ray2 (br2), cleithrum (c), ceratobranchial 5 (cb), ceratohyal (ch), dentary (d), hyomandibular (hm). (E-J) 10dpf zebrafish larvae after 5 days chemical treatments. (E-G) Alcian blue staining of cartilage. (H-J) Alizarin red staining of bone. (E,H) Controls in DMSO. (F,G) no significant effect of, respectively VitD3 and PTH on cartilage development, nor on chondrocyte shape or size (inlays showing close-up). I: increase of bone development after VitD3 treatment. (J) decrease of bone development after PTH treatment. Ventral views, anterior to the left, (E-J) scale bar = 250µm. PHENOTYPE:
|

ZFIN is incorporating published figure images and captions as part of an ongoing project. Figures from some publications have not yet been curated, or are not available for display because of copyright restrictions. PHENOTYPE:
|

ZFIN is incorporating published figure images and captions as part of an ongoing project. Figures from some publications have not yet been curated, or are not available for display because of copyright restrictions. PHENOTYPE:
|

ZFIN is incorporating published figure images and captions as part of an ongoing project. Figures from some publications have not yet been curated, or are not available for display because of copyright restrictions. |
|
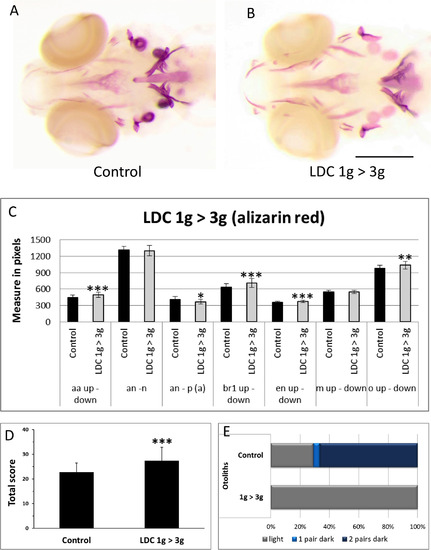
Effect of 3g hypergravity between 5?9dpf on bone formation. (A,B) Alizarin red staining of 9dpf control larvae (A) and larvae treated for 4 days in 3g hypergravity after 5 days at 1g (B). Ventral view, anterior to the left. (C) Comparison of morphometric measurements for some selected distances within the heads of control and 3g-treated larvae. Mean ± SD and t-test analysis were calculated for each measure on at least 20 individuals. * p < 0.05, ** p < 0.01 and ***p < 0.001. (D) Global score for bone formation in control and 3g treated larvae. (E) Comparison of cumulated frequencies of, respectively light, 1 pair dark or two pairs dark otoliths in control and 3g treated larvae. For abbreviations see legend to Fig 1. PHENOTYPE:
|
|
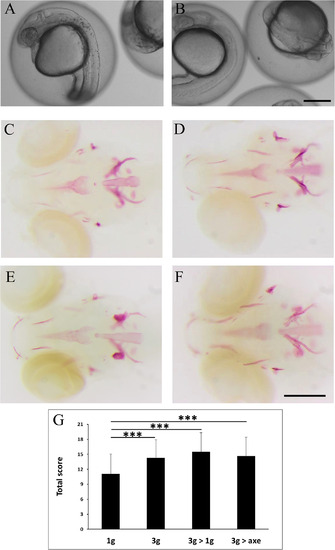
Effect of "relative microgravity" between 5?6dpf on bone formation. (A, B) comparison of pigmentation at 24hpf in 1g (A) and 3g (B) larvae. (C-F) Alizarin red staining of larvae kept at 1g until 6dpf (1g, C), control larvae kept at 3g until 6dpf (3g, D), larvae kept at 3g until 5dpf and returned to 1g off the centrifuge (3g>1g, E) or on the axis (3g>axe, F), Ventral view, anterior to the left. (G) Global scores for bone formation in control and the different treated larvae. PHENOTYPE:
|


