Fig. 1
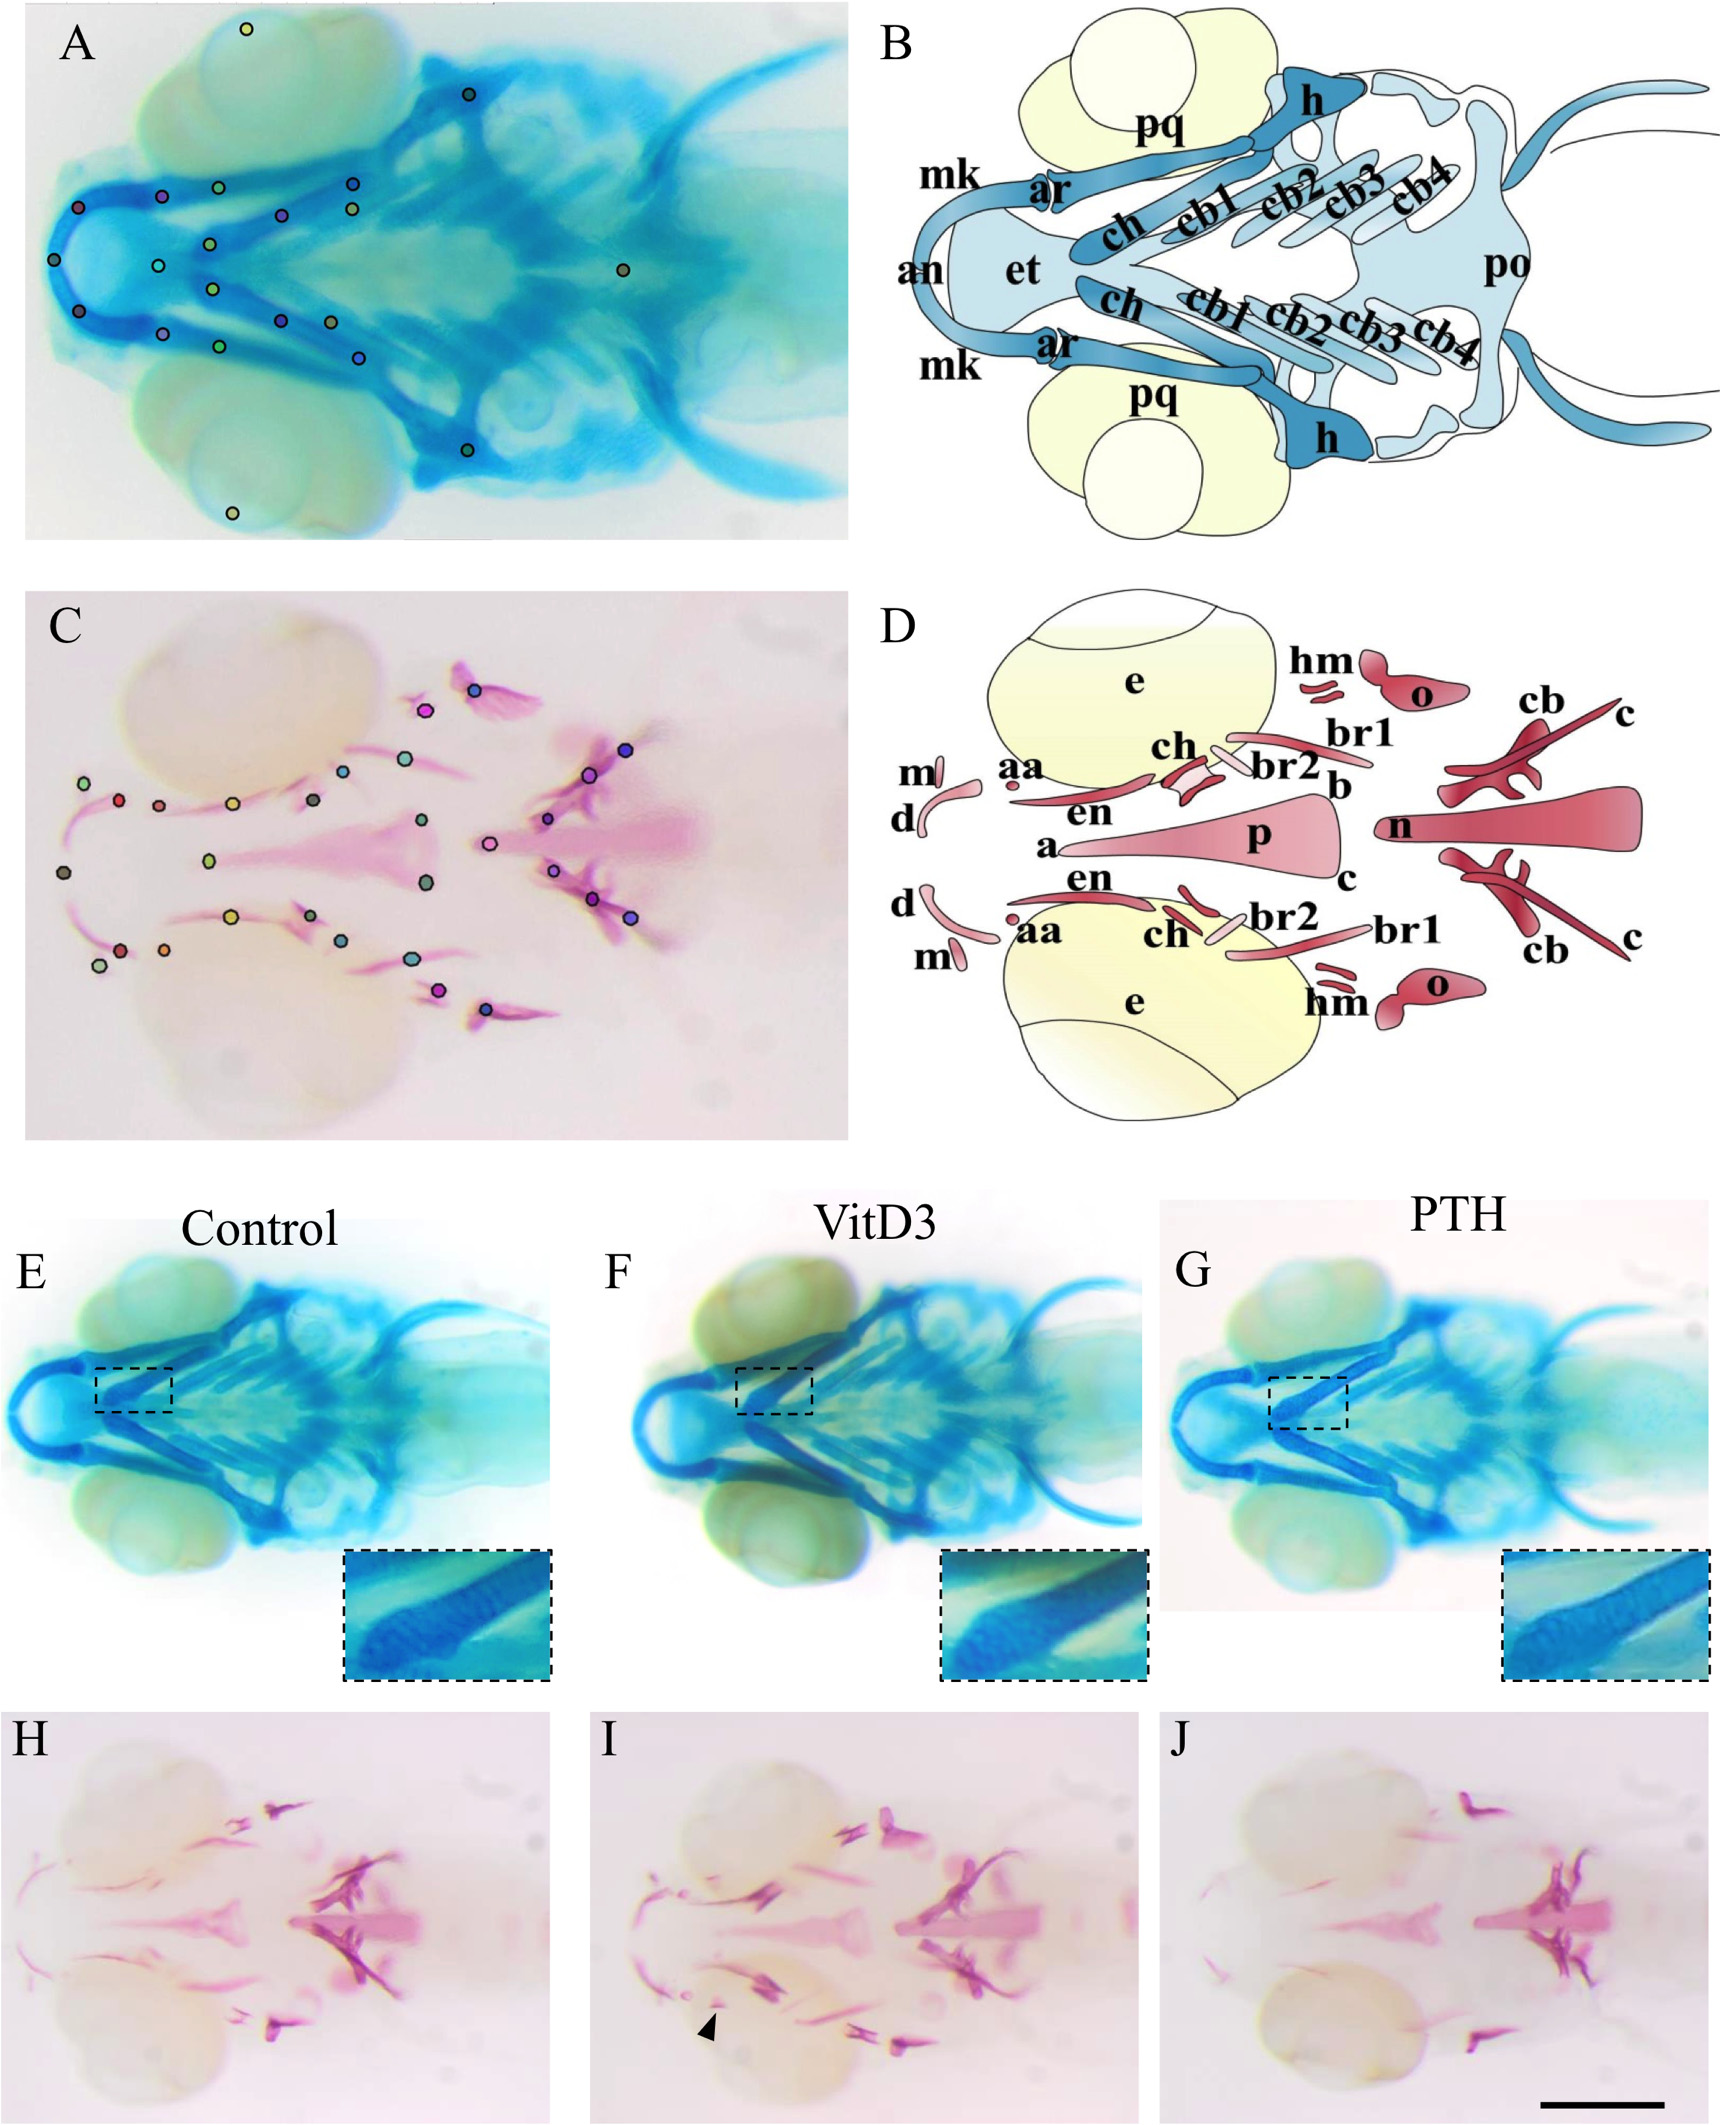
(A-D) Cartilage and bone elements of the head skeleton in 10dpf zebrafish.
(A) Alcian blue staining of head cartilage representing the landmarks used for morphometry. (B) Schematic representation of the different head cartilage elements. anterior limit (an), articulation (ar), ceratobranchial pairs 1 to 4 (cb1-4), ceratohyal (ch), ethmoid plate (et), hyosymplectic (h), Meckel′s cartilage (mk), palatoquadrate (pq), posterior limit (po). (C) Alizarin red staining of cranial bones representing the landmarks used for morphometry. (D) Schematic representation of the different cranial bone elements with 29 landmarks used for chemicals treatments and 15 landmarks for the 3g and the relative-hypergravity. The 15 landmarks are anguloarticular (aa), anterior (an), branchiostegal ray1 (br1), entopterygoid (en), maxilla (m), notochord (n), opercle (o), parasphenoid (p). Note that the parasphenoid is a triangular bone defined by its anterior summit (a) and two posterior summits (b,c). The 29 landmarks include the 15 named before with branchiostegal ray2 (br2), cleithrum (c), ceratobranchial 5 (cb), ceratohyal (ch), dentary (d), hyomandibular (hm). (E-J) 10dpf zebrafish larvae after 5 days chemical treatments. (E-G) Alcian blue staining of cartilage. (H-J) Alizarin red staining of bone. (E,H) Controls in DMSO. (F,G) no significant effect of, respectively VitD3 and PTH on cartilage development, nor on chondrocyte shape or size (inlays showing close-up). I: increase of bone development after VitD3 treatment. (J) decrease of bone development after PTH treatment. Ventral views, anterior to the left, (E-J) scale bar = 250Ám.

