- Title
-
Asymmetric inheritance of the apical domain and self-renewal of retinal ganglion cell progenitors depend on Anillin function
- Authors
- Paolini, A., Duchemin, A.L., Albadri, S., Patzel, E., Bornhorst, D., Gonzßlez Avalos, P., Lemke, S., Machate, A., Brand, M., Sel, S., Di Donato, V., Del Bene, F., Zolessi, F.R., Ramialison, M., Poggi, L.
- Source
- Full text @ Development
|
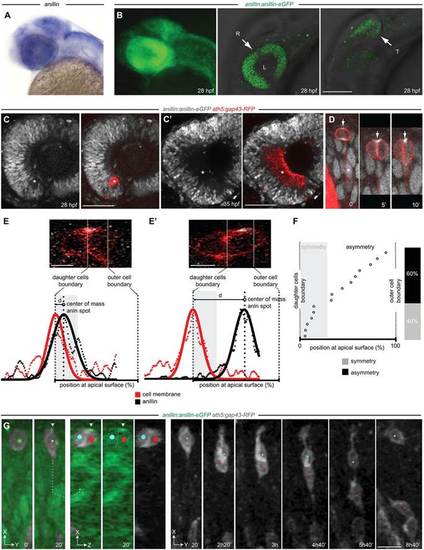
Anillin expression during zebrafish retinal differentiation. (A) anillin mRNA (blue) at 28 hpf. (B) Expression of the anillin-eGFP transgene. R, retina; T, optic tectum; L, lens. Left, z-projection view; middle and right, z-plane. (C,C2) anillin:anillin-eGFP/ath5:gap43-RFP transgenic retina. anillin-eGFP is downregulated in the differentiating cells of the RGC layer (asterisks). (D) Anillin-GFP localisation in the nucleus (asterisk), cleavage furrow (arrow, t=02) and at the midbody (arrow, t=52 and t=10′). Time, minutes. (E,E′) Anillin-eGFP symmetric (E) and asymmetric (E′) distribution and intensity profiles (data points and fitted Gaussian) used to detect the offset of the Anillin-eGFP spot from the daughter cell boundary. (F) The position of apical Anillin-eGFP (n=15 divisions). Distance from the cell boundary within the average radius of the Anillin spot (grey) is used to define symmetry (see supplementary material Fig. S3). (G) Frames from supplementary material Movie 1. The Anillin-eGFP spot-inheriting daughter (white arrowhead, red dot) migrates to the RGC layer. The sibling (blue dot) migrates back to the apical surface (n=5 out of 5 analysed divisions). At t=20′ a rotated frontal z-section (dotted lines, 3D slicing mode) across the centre of the dividing daughters is shown (oriented along the z-plane). The apical surface of the retinal neuroepithelium is to the top. Scale bars: 110Ám in B; 25Ám in C,C′; 6Ám in E,E′; 12Ám in G. |
|
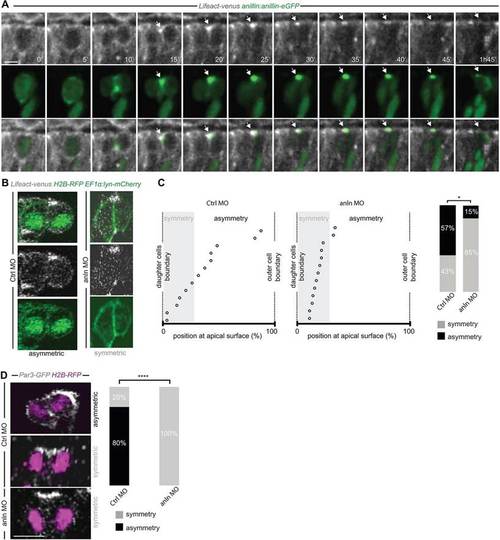
Anillin is required for the apical distribution of F-actin and Par3. (A) Frames from supplementary material Movie 3. F-actin accumulates at the Anillin-eGFP-labelled midbody (arrow) at the end of cytokinesis. (B) Asymmetric (CtrlMO; frames from supplementary material Movie 4) and symmetric (anlnMO; frame from supplementary material Movie 5) distribution of apical F-actin accumulation. (C) Position of the apical F-actin-rich domain (CtrlMO, n=14; anlnMO, n=13) (as described in Fig. 1E-F and supplementary material Fig. S3); the frequency of asymmetry is 57% in CtrlMO and 15% in anlnMO (Wilcoxon Mann?Whitney test, *P<0.05). (D) Symmetric versus asymmetric inheritance of Par3 in CtrlMO (frame from supplementary material Movie 6) and anlnMO (frame from supplementary material Movie 7) injected embryos (two-tailed Fisher′s exact test, ****P=104, CtrlMO, n=15; anlnMO, n=15). All images represent a single z-plane of a confocal stack. The apical surface of the retinal neuroepithelium is to the top. Scale bars: 4.8Ám in A; 5Ám in D. |
|
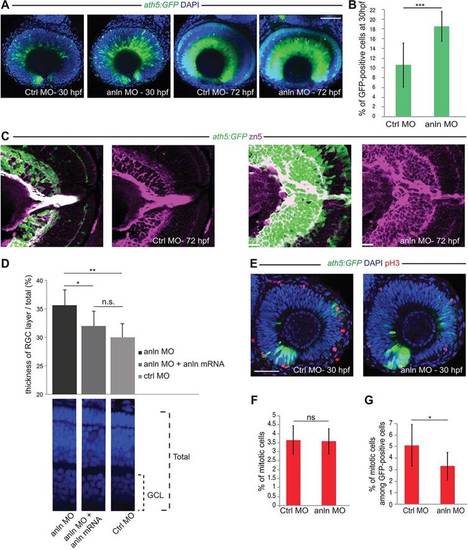
anillin hypomorphic conditions affect RGC number. (A) anlnMO-injected retinae (z-projections) showing increase of Ath5:GFP signal (CtrlMO, n=24; anlnMO, n=31). (B) Quantification of GFP-positive among total (DAPI) cells, which increased from 10.5▒1.6% (s.e.m.) in CtrlMO to 18.5▒1.2% (s.e.m.) in anlnMO (Student′s t-test, ***P<0.001; CtrlMO, n=8; anlnMO, n=7). (C) Retina frontal sections. Zn5 (Alcama) staining reveals expansion of the RGC layer in anlnMO retinae. (D) Rescue of the anlnMO phenotype. Student′s t-test, *P<0.05, **P<0.01; n.s., not significant (P=0.11); anlnMO and CtrlMO, n=7; anlnMO+anln-eGFP mRNA, n=8. GCL, ganglion cell layer. (E) Phospho-histone H3 (pH3) labelling of mitotic cells (z-projections). (F) Ratio of pH3-positive among total DAPI-positive cells; 3.65▒0.3% CtrlMO, 3.57▒0.3% anlnMO (Student′s t-test, P=0.46; CtrlMO, n=8; anlnMO, n=7). (G) Ratio of pH3-positive cells among GFP-positive cells is 5.1▒0.6% for CtrlMO versus 3.3▒0.5% for anlnMO (Student′s t-test, *P<0.05; CtrlMO, n=8; anlnMO, n=7). Scale bars: 42 Ám in A,E; 23.5 Ám in C. EXPRESSION / LABELING:
PHENOTYPE:
|
|
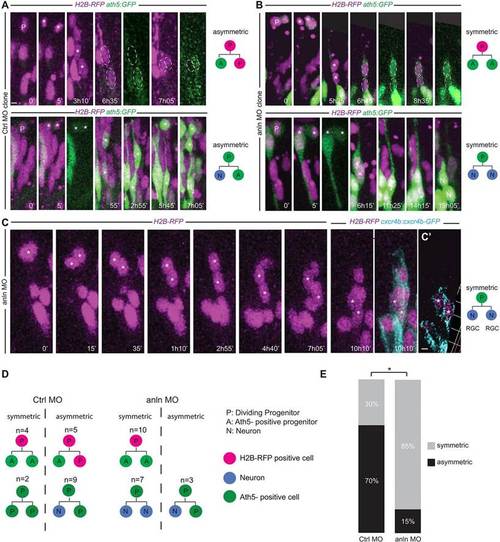
anillin hypomorphic conditions affect the balance between symmetric and asymmetric cell division of RGC progenitors. (A,B) Frames from supplementary material Movies 10-13 showing examples of symmetric and asymmetric division outcomes in the CtrlMO (A) and anlnMO (B) conditions. GFP intensity differences for A/P and A/A divisions were quantified (P<0.05 for CtrlMO clones; P=0.92 for anlnMO clones). (C) Division (asterisk) generating two Cxcr4b-eGFP-positive daughters (cyan) (10h 10′). Each time frame represents a z-projection. (C′) A single z-stack. (D,E) Symmetric divisions increase from 30% in the CtrlMO to 85% in the anlnMO (two-tailed Fisher′s exact test, *P=0.011). Apical surface of the retinal neuroepithelium is to the top. Scale bars: 5Ám in A,B; 5.5Ám in C,C′. |
|
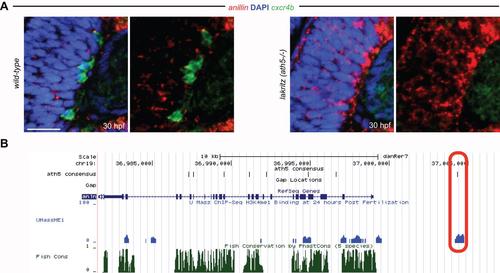
Reciprocal regulation between Anillin and Ath5. (A) Ath5-/- (lakritz) mutant embryos retain anillin expression in the central retina where progenitors fail to exit the cell cycle and to differentiate into RGCs (highlighted by the cxcr4b expression in the wild-type retina). Scale bar: 21 Ám. Anterior is always to the left, dorsal is to the top. (B) UCSC genome browser (https://genome.ucsc.edu/) overview of the anillin locus. Red-circled area shows the overlap between histone 3 lysine 4 monomethylation marks (indicative of cis-regulatory activity) at 24 hpf (blue) with Ath5 consensus binding site (black) 5 kb upstream of anillin transcription start site. |
|
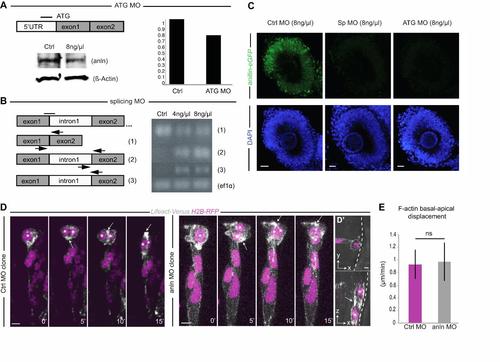
Anillin-specific morpholinos efficiently downregulate anillin. (A) Anillin-specific translation-blocking morpholino (ATG MO). Western blot showing 24.63% downregulation of endogenous Anillin expression levels. β-actin was used as the loading control. (B) Anillin splice-blocking MO (Sp MO). Black arrows indicate the binding site splice-assay primers assessed by RT-PCR. On the right, a decrease of the properly spliced form (1) and an increase of the intron 1 retention forms (2 and 3) are evident at 30 hpf. ef1a was used as a housekeeping gene. (C) Injection of both morpholinos efficiently decrease Anillin-eGFP expression in anillin:anillin-eGFP transgenic embryos. Scale bar: 100 Ám. (D) Basal to apical displacement of the F-actin spot (LifeAct-Venus) during cytokinesis progression in a control MO and anlnMO cell clone. Each image represents the extended focus of a confocal stack. Asterisks indicate the position of nuclei (H2B-RFP). Scale bar: 5.1 Ám. (D′) Orthogonal views of the division (t=5′) in the anlnMO clone, which remains parallel to the apical surface of the epithelium (highlighted with the white dashed line). Scale bar (white arrow): 10 Ám. (E) Average F-actin spot basal to apical displacement during furrowing is not significantly different between control (magenta) and anillin MO (grey) clones (from 0.93 Ám/minutes ▒ 0.2 Ám/minutes SEM CtrlMO to 0.97 Ám/minutes ▒ 0.3 Ám/minutes SEM anlnMO, Student?s t-test p=0.6, CtrlMO-injected n=30; AnlnMO-injected, n=27). Apical surface of the retinal neuroepithelium to the top. |
|
Image-based detection of the Anillin and F-actin patch offset from the cell boundary (see also Fig. 1E,E′). (A-C) Images were rotated to reorient the daughter cell boundary vertically. (A) First, snapshots of frontal z-levels across the centre of the dividing daughters were obtained using the 3D slicing mode from the Volocity software (PerkinElmer). To find the best possible frontal z-slice, membrane and/or histone-tagged fluorescent protein fusions were used as reference. A division of an anillin:anillin-eGFP/ath5:gap43-eGFP expressing cell is shown as example (see also Fig. 1E,E′ and 2B). Next, the daughter cell interface was assessed by determining the maximum intensity of the membrane-tagged gap43-RFP (or lyn-mCherry for the F-actin) in three points along the apical to basal cell body axis. (B) The boundary was estimated by fitting a line through the three intensity maxima and (C) a rotation was applied to obtain a vertically oriented line. The position of the Anillin or F-actin centre of mass was determined by the maximum of the intensity profile from the Anillin (black data points in Fig. 1E,E′) or F-actin channel using the ?plot profile? tool in Fiji. Values of associated Gaussian (black curve in Fig. 1A) were obtained using the ?curve fitting? tool. (D) To calculate and normalize the offset of the Anillin spot from the cell boundary, the region of interest was centred on the vertical daughter cell boundary and extended to both outer cell membranes at the same latitude of the Anillin spot. (D′) The position of the Anillin centre of mass was determined by the maximum of the intensity profile from the Anillin channel. For each dividing daughters, the distance between the calculated maximum intensity value for membrane (daughter cell boundary) (red curve in Fig. 1E,E′) and the Anillin or F-actin centre of mass (black curve in Fig. 1E,E′) was determined. Plots representing the position of the Anillin or F-actin spot at the apical surface (Fig. 1F and Fig. 2C) were obtained and normalized between 0 (daughter cell boundary) and 100% (outer cell boundary). A distance from the cell boundary larger than the average radius of the Anillin or F-actin spot was used to define asymmetric positioning. |

