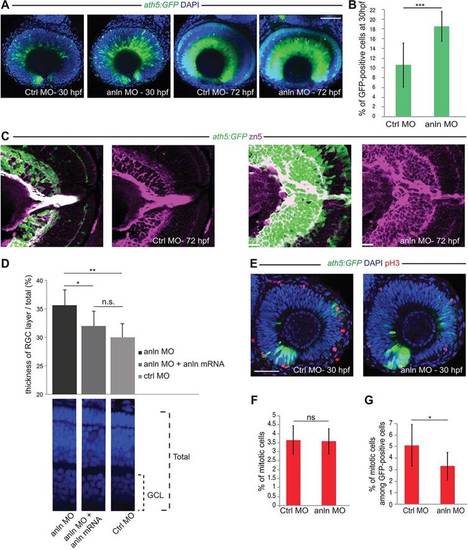
anillin hypomorphic conditions affect RGC number. (A) anlnMO-injected retinae (z-projections) showing increase of Ath5:GFP signal (CtrlMO, n=24; anlnMO, n=31). (B) Quantification of GFP-positive among total (DAPI) cells, which increased from 10.5�1.6% (s.e.m.) in CtrlMO to 18.5�1.2% (s.e.m.) in anlnMO (Student′s t-test, ***P<0.001; CtrlMO, n=8; anlnMO, n=7). (C) Retina frontal sections. Zn5 (Alcama) staining reveals expansion of the RGC layer in anlnMO retinae. (D) Rescue of the anlnMO phenotype. Student′s t-test, *P<0.05, **P<0.01; n.s., not significant (P=0.11); anlnMO and CtrlMO, n=7; anlnMO+anln-eGFP mRNA, n=8. GCL, ganglion cell layer. (E) Phospho-histone H3 (pH3) labelling of mitotic cells (z-projections). (F) Ratio of pH3-positive among total DAPI-positive cells; 3.65�0.3% CtrlMO, 3.57�0.3% anlnMO (Student′s t-test, P=0.46; CtrlMO, n=8; anlnMO, n=7). (G) Ratio of pH3-positive cells among GFP-positive cells is 5.1�0.6% for CtrlMO versus 3.3�0.5% for anlnMO (Student′s t-test, *P<0.05; CtrlMO, n=8; anlnMO, n=7). Scale bars: 42 �m in A,E; 23.5 �m in C.
|
