
- Title
-
Hapln1a is required for connexin43-dependent growth and patterning in the regenerating fin skeleton
- Authors
- Govindan, J., and Iovine, M.K.
- Source
- Full text @ PLoS One
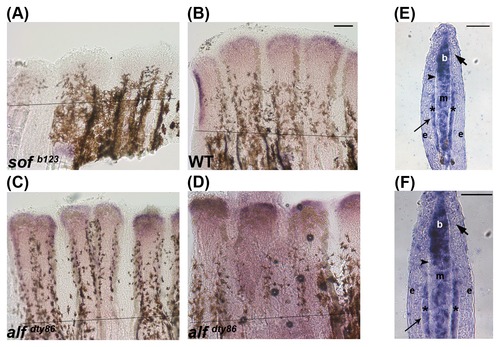
Validation of microarray results by in situ hybridization using whole mount in situ hybridization on 5 dpa regenerating fins. (A) hapln1a expression is reduced in sof b123 compared with WT (B). alf dty86 expression is variable (C,D). (E,F) In situ hybridization on a WT 5 dpa cryosection reveals compartment specific expression of hapln1a, mainly in the blastema (b), in the mesenchyme (m), and skeletal precursor cells (*). The thick arrow identifies the basal layer of the epidermis, which underlies the epidermis (e). The thin arrow identifies lepidotrichia and the arrowhead identifies the actinotrichia. The amputation plane is indicated in panels A-D. Scale bar in E and F is 50 μm. EXPRESSION / LABELING:
|
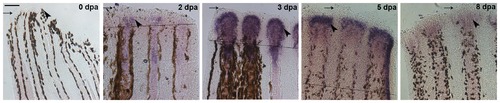
hapln1a expression pattern at different time points in regenerating fin. Whole mount in situ hybridization for hapln1a on regenerating fins at different time points. The hapln1a gene is not expressed during normal fin growth (uncut). Expression of hapln1a initiates around 2 dpa and is maximally expressed at 3 dpa, followed by gradual reduction at 5 dpa and 8 dpa. Arrow identifies the distal end of the fin; the arrowhead identifies region of staining (or where staining would be observed in uncut fins). The amputation plane is indicated for 2 dpa, 3 dpa, and 5 dpa, and is out of the field of view for the 8 dpa image. Scale bar is 50 μm. EXPRESSION / LABELING:
|
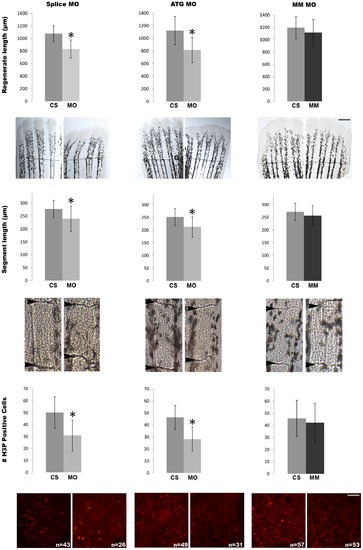
Morpholino mediated knock-down of hapln1a recapitulates all cx43-dependent phenotypes. (Top row) Total regenerate length was measured in MO and MM treated fins. Hapln1a knock-down resulted in reduced fin length (*). The dotted line represents the amputation plane. (Middle row) Segment length was measured in MO and MM treated fins. Hapln1a knock-down resulted in reduction of segment length (*). Arrowheads identify joints. (Bottom row) Total number of H3P positive cells (red) was counted. Images of representative whole fins stained for H3P are shown for each condition. Knock-down of Hapln1a resulted in reduced cell proliferation (*) compared to the mismatch control. MO represents targeting morpholino; ATG MO targets translation initiation; Splice MO targets splicing event; MM represents control morpholino with 5 mismatches to target sequence; CS represents uninjected/untreated side. All experiments were completed in triplicate with a minimum of five fins treated with MO per trial. Statistical significance was determined by student′s t-test where p<0.05. By student′s t-test, there is no statistical difference between MM and CS. Error bars represent the standard deviation. Scale bar is 50 μm. PHENOTYPE:
|

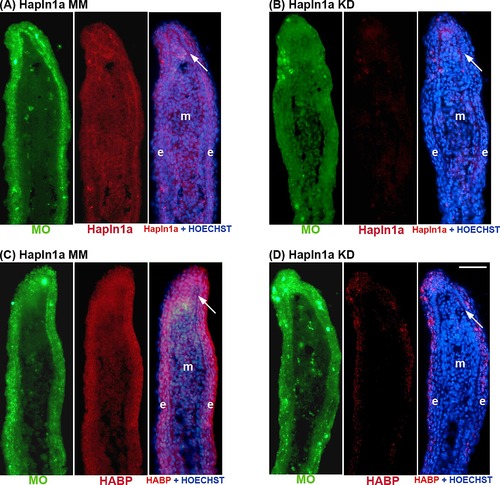
Morpholino mediated knock-down of hapln1a in WT regenerating fins results in reduced Hapln1a. Immunostaining for Hapln1a and HOECHST staining for DNA (blue). The green reveals the location of the targeting and control MOs, which are fluorescein tagged. (A) Longitudinal section of a fin ray treated with Hapln1a control morpholino (MM). (B) Longitudinal section of a fin ray knocked down for Hapln1a with a targeting morpholino (KD). Compared to the control MM fins, Hapln1a knock-down (KD) fins exhibit reduced staining for Hapln1a. (C) Immunoblots confirming reduced levels of Hapln1a protein following Hapln1a knockdown. Hapln1a-MO treated fins (KD) were compared to control morpholino (MM). Tubulin was used as a loading control. Arrow identifies the basal layer of the epidermis; m, mesenchyme; e, epithelium. Scale bar is 50 μm. |
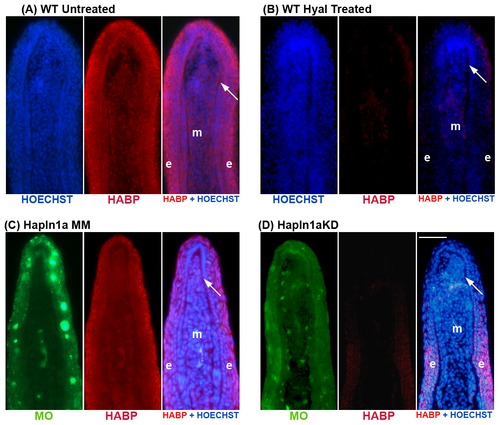
Morpholino mediated knock-down of hapln1a in WT regenerating fins results in reduced HA levels. HA is detected by biotin-HABP with streptavidin-Alexa-546. HOECHST detects DNA (blue). The green reveals the location of the targeting and control MOs, which are fluorescein tagged. (A,B) Fin sections from 5 dpa WT regenerating fins were either untreated or treated with hyaluronidase. The reduced signal in the hyaluronidase-treated sections demonstrates that HABP detects HA. (C) Longitudinal section of a fin ray treated with Hapln1a control morpholino (MM). (D) Longitudinal section of a fin ray knocked down for Hapln1a with a targeting morpholino (KD). Compared to the control MM fins, Hapln1a knock-down (KD) fins exhibit reduced staining for HA. Arrow identifies the basal layer of the epidermis; m, mesenchyme; e, epithelium. Scale bar is 50 μm. |

HA levels are reduced in sof b123 and in cx43-KD regenerating fins. Immunostaining for HA (Red) and HOECHST staining for DNA (blue). In the panels treated for cx43-MO or MM, the green reveals the location of the MOs, which are fluroescein tagged. HA levels were detected as described in Figure 4. (A,C) HA levels in WT 5 dpa regenerating fins and in WT fins treated for cx43-MM. (B,D) HA levels are reduced in sof b123 regenerating fins and in WT fins treated for cx43-MO. Arrow identifies the basal layer of the epidermis; m, mesenchyme; e, epithelium. Scale bar is 50 μm. |
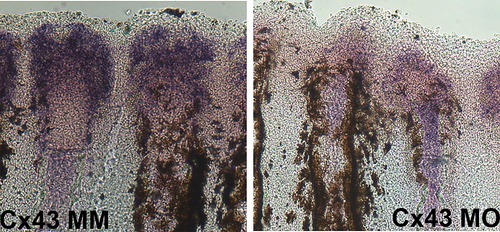
Cx43 knock down results in reduced expression levels of hapln1a. Whole mount in situ hybridization shows reduced expression of hapln1a in WT fins treated for cx43 knock-down (Cx43KD) fins compared to WT fins treated for cx43 mismatch control (Cx43MM) control fins. |
The hapln1a-KD was effective in alf dty86. Immunostaining for Hapln1a or HA (Red) and HOECHST staining for DNA (blue). The green reveals the location of the targeting and control MOs, which are fluroescein tagged (A) Longitudinal section of an alf dty86 fin ray treated with Hapln1a control morpholino (MM). (B) Longitudinal section of an alf dty86 fin ray knocked down for Hapln1a with a targeting morpholino (KD). Compared to the control MM fins, Hapln1a knock-down (KD) fins exhibit reduced staining for Hapln1a. HA was detected by biotinylated-HABP followed by streptavidin-Alexa 546 conjugate. (C) Longitudinal section of an alf dty86 fin ray treated with Hapln1a control morpholino (MM). (D) Longitudinal section of an alf dty86 fin ray knocked down for Hapln1a with a targeting morpholino (KD). Compared to the control MM fins, Hapln1a knock-down (KD) fins exhibit reduced staining for HA. Arrow identifies the basal layer of the epidermis; m, mesenchyme; e, epithelium. Scale bar is 50 μm. |