- Title
-
Mutations in LRRC50 Predispose Zebrafish and Humans to Seminomas
- Authors
- Basten, S.G., Davis, E.E., Gillis, A.J., van Rooijen, E., Stoop, H., Babala, N., Logister, I., Heath, Z.G., Jonges, T.N., Katsanis, N., Voest, E.E., van Eeden, F.J., Medema, R.H., Ketting, R.F., Schulte-Merker, S., Looijenga, L.H., and Giles, R.H.
- Source
- Full text @ PLoS Genet.
|
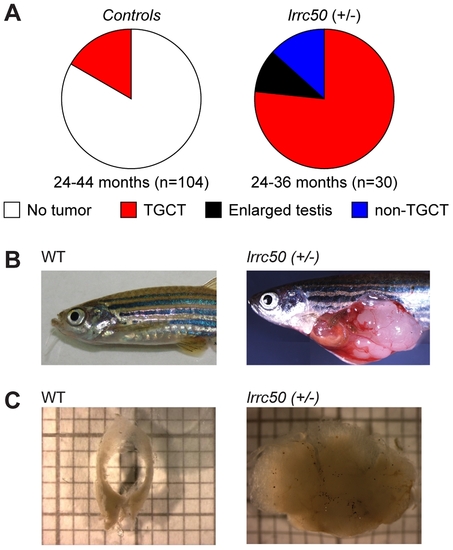
Heterozygous lrrc50Hu255h zebrafish are predisposed to testicular tumor formation. (A) Incidences of tumors extracted from randomly selected male controls derived from ENU-mutagenesis (n = 104) and heterozygote male lrrc50Hu255h (n = 30) zebrafish between 24?44 months of age are summarized in pie charts. Tumor formation presented as both TGCT and non-TGCT (sporadic tumors in somatic tissues) in the lrrc50Hu255h cohort (90%) is significantly elevated from TGCT (16.3%) formation in the controls (P<0.0001). No alternative tumor types were noticeable in the control group. (B) An age-matched wild-type zebrafish compared to a TGCT bearing lrrc50+/ zebrafish (skin around tumor removed; merge of three images). (C) Wild-type testes are composed of two tubular arms forming the paired gonad. The tissue architecture is severely disrupted in the tumor. |
|
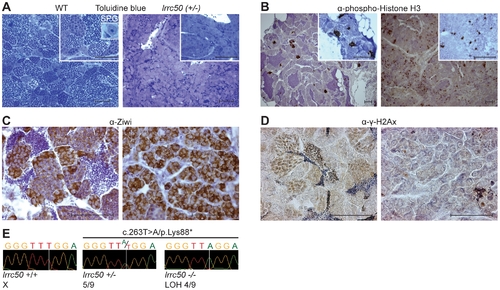
Characterization of lrrc50Hu255h zebrafish TGCT suggests analogy to human seminoma. (A?D) Histological characterization of wild-type testis (left panels) and lrrc50H255h tumors (right panels). Two magnifications shown A, B (largest in insert) all scale bars; 50 μm. The characterization indicates the presence of predominantly early germ cells and loss of differentiated germ cells in the tumors. (A) Morphological tissue analysis of toluidine blue stained sections indicates the presence of all stages of spermatogenesis in normal tissue (extensively described in Figure S3A), and shows a dramatic loss of differentiated germ cells in the tumor. (B) IHC characterization with proliferation marker α-phospho-HistoneH3 (pH3) shows synchronously dividing cell-clusters in normal tissue, indicative of differentiated germ cells. Early SPG is the only germ cell that can divide as a single cell, and the tumors show mostly single proliferating cells. Increased pH3 staining suggests the tumor tissue is highly proliferative (quantified in Figure S4A). (C) IHC using α-Ziwi (strong cytoplasmic expression). In normal tissue, Ziwi expression is restricted to early SPG and gradually and diffusely lost differentiated germ cells. With the exception of somatic tissue, the tumors are almost completely composed of early SPG. (D) IHC with meiosis marker α-γ-H2Ax shows normal tissue that is composed of various stages of differentiation, whereas these are predominantly absent in tumor tissue. (E) Chromatograms of WT zebrafish, heterozygote lrrc50Hu255h and lrrc50Hu255h tumors. We observe a loss of the remaining wild-type allele c.263T>A/p.Lys88* in 44.4% of the tumors (LOH). PHENOTYPE:
|
|
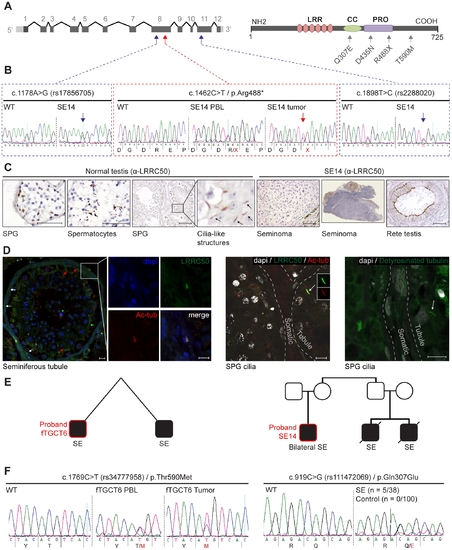
Genetic analysis of LRRC50 in human seminoma samples. (A) LRRC50 spans 12 exons on chromosomal arm band 16q24.1. All recovered genetic variations (see Table 2) are indicated in the LRRC50 structure. (B) Chromatogram of SE14-PBL reveals a germline heterozygous nonsense c.1462C>T/p.Arg488* (TMP_ESP_16_84203896) mutation (red arrow in A). Bilateral SE14-seminomas (one sample shown) show a constitutively stronger mutant peak. Analysis of up- and downstream SNPs in closest proximity (blue arrows in A), c.1178A>G/rs17856705 in exon 8 and c.1898T>C/rs2288020 in exon 11, render equivalent peak intensities, indicative of a regional LOH in the tumor. (C) IHC for LRRC50 stains SPG and spermatocytes in normal testis, interestingly; structures reminiscent of cilia in SPG are observed. The SE14 tumor shows complete loss of LRRC50 protein expression. Motile cilia staining of non-tumorigenic tissue (rete testis) from SE14 supports antibody specificity and proper fixation of tumor SE14 tissue. Scale bars; 50 Ám. (D) IF of normal testis tissue indicates LRRC50 in cilia on germ cells lining the seminiferous tubule (red arrows) and somatic tissue of the seminiferous tubules (white arrows and insert). Early germ cells localize peripheral to the seminiferous tubule and higher resolution images (maximal projections of Z-stacks) show the presence of solitary cilia in these germ cells in more detail using cilia markers acetylated-α-tubulin (Ac-tub) and detyrosinated-tubulin, LRRC50 locates to cilia in these SPG. Scale bars; 10 μm (E) fTGCT6 and SE14 proband pedigrees. (F) Genotyping LRRC50 in the seminoma collection (n = 38) identified one sample with a c.1769C>T/p.Thr590Met (rs34777958) allele. Additionally, heterozygous variation c.919C>G/p.Gln307Glu (rs111472069) was identified in five seminoma samples, representing a significant enrichment (P = 0.0013). Both variations are absent in a healthy control group (n = 100). |
|
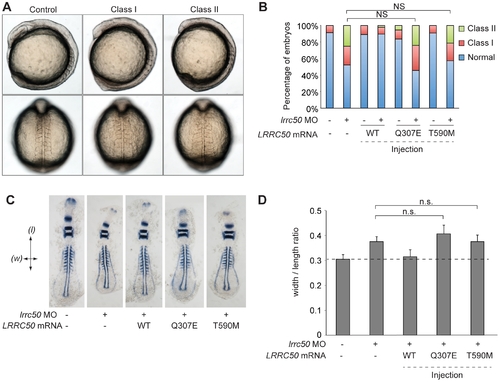
LRRC50 missense changes are functional nulls in a zebrafish model of development. (A) Live embryo images of lrrc50 morphants. Morpholino (MO) mediated suppression of lrrc50 gives rise to gastrulation defects in mid-somitic zebrafish embryos that can be categorized according to previously established objective scoring criteria. Representative lateral and dorsal views are shown (top and bottom panels respectively). (B) Scoring of in vivo complementation; WT embryos were injected with MO and/or human mRNA and scored at the 8?9 somite stage according to phenotypes shown in panel A. Gln307Glu and Thr590Met are not significantly different (NS; c2) from MO alone suggesting that both are functional nulls, n = 44?79 embryos/injection repeated twice with masked scoring. (C) Representative images of flat mounted in situ hybridized (ISH) zebrafish embryos labeled with a cocktail of krox20, myoD, and pax2a riboprobes. Arrows indicate measurement parameters for morphometric analyses shown in panel D; length (l) was measured as the anterior-posterior distance from the first to the last appreciable somite; width (w) was measured as the distance spanning the lateral tips of the fifth somites counted from anterior to posterior. (D) Morphometric quantification of Gln307Glu and Thr590Met gastrulation defects. Images of flat-mounted embryos age-matched at 9 somites were measured in two dimensions (as shown in panel C); the ratios of medial-lateral (width; w) versus anterior-posterior (length; l) measurements are shown for randomly chosen embryos from live scoring experiments (panels A and B) for ISH. LRRC50 Gln307Glu and Thr590Met do not produce a significant rescue in comparison to MO alone (NS; t-test), corroborating the in vivo scoring results in panel B (n = 9?13 embryos/injection). Error bars indicate standard deviation of the mean. PHENOTYPE:
|
|
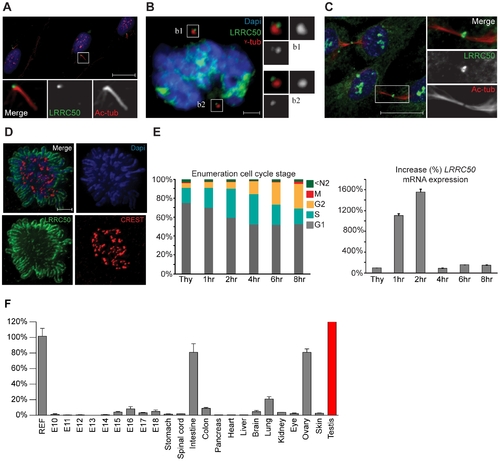
Localization and expression of LRRC50. LRRC50 antibody ab75163 (reproducible with alternative LRRC50 antibodies) shows a dynamic, cell cycle dependent, distribution in RPE-hTERT cells (representative for other tested mammalian cell lines). Panels represent LRRC50 (green) at various stages, counterstained with DAPI (blue) and acetylated-α-tubulin (Ac-tub, red). Optical sections in A-C are 3 μm. (A) In ciliated serum-starved cells, LRRC50 localizes to the peripheral centrosome/basal body region dorsal of the axoneme (red). Scale bar 10 μm. (B) In mitotic cells, LRRC50 remains associated with the duplicated centrosomes, as indicated with γ-tubulin (red). Inserts b1,2 demonstrate a peri-centrosomal localisation. Scale bar 2 μm. (C) Temporal localization to the midbody in cytokinesis. Scale bar 10 μm. (D) During mitosis LRRC50 dynamically associates with condensed chromosomes (extensively described in Figure S5B). Counterstain CREST (red) marks kinetochores. Image is a maximum intensity projection of deconvoluted stacks. Scale bar 2 μm. (E) Dynamic LRRC50 mRNA expression (correlating with dynamic localization) with error bars as standard deviation. T47D cells synchronized at the G1/S transition with thymidine show a strong LRRC50 transcript up-regulation upon release, specifically in the cell population entering early S-phase (see also Figure S6A). Intriguingly; although the protein remains stable during mitosis (shown in D) the transcript is rapidly down-regulated, and restored to basal levels. (F) Expression profiling of LRRC50 mRNA expression with error bars of standard deviation in a library of mouse cDNA tissues normalized to full mouse reference pool. Testis expression shown in red as the expression level (>26.000%) strongly exceeds the normalized value. |
|
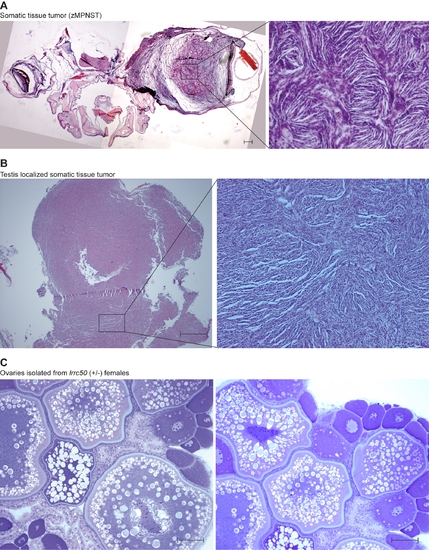
Non-TGCT zebrafish lrrc50Hu255h tumors and female gonad. (A) One fish was identified bearing a large tumor (merge of two images) located proximal to the brain, histologically resembling zebrafish malignant peripheral nerve sheath tumors (zMPNST). Albeit a rare finding in lrrc50Hu255h zebrafish, these tumors typically do not occur in wild-type zebrafish and might therefore potentially represent an alternative lrrc50 associated tumor type. Scale bars; 50 μm. (B) We identified a tumor of somatic tissue (undetermined pathology, putative zMPNST) located in the testes of one zebrafish, unlike all other TGCTs described in this manuscript. Scale bars; 50 μm. (C) Heterozygote lrrc50 females (n = 11) do not show gonadal abnormalities; ovaries were isolated simultaneously with male testes/TGCT at an age of 30 months. Scale bars; 50 μm. |
|
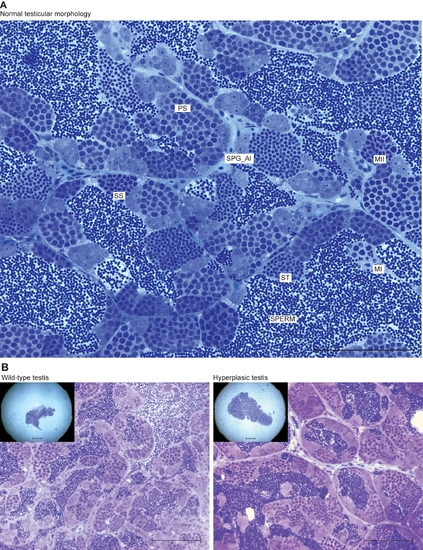
Zebrafish spermatogenesis and lrrc50Hu255h testicular hyperplasia. (A) The various stages of spermatogenesis in zebrafish can be morphologically distinguished and are indicated in a section from wild type zebrafish. Spermatogonial stem cells (SPG) that commit to spermatogenesis from clusters of paired (SPG_paired) and aligned spermatogonia (SPG_al) by mitotic divisions. All differentiated germ cells remain connected via stabilised intracellular bridges that allow the shared use of cytoplasmic components. This elegant mechanism is essential to synchronise collective mitosis, meiosis, differentiation and apoptosis of these clusters of cells. Next, SPG_al collectively differentiate into primary spermatocytes (PS), reducing cytoplasmic volume and severely modifying nuclear structure. Meiosis is the next step of differentiation, and occurs via the first (MI) and second (MII) meiotic divisions, forming haploid cells, these cells are known as secondary spermatocytes (SS). These cells contain one copy of the genome and need no further divisions; instead, these cells differentiate into spermatids (ST) that eventually form mature sperm. Scale bars; 100 μm. (B) Wild-type and hyperplastic testes of heterozygote lrrc50Hu255h zebrafish. A total of three have been identified, all showing moderate to extreme increases in testes volume, however upon histology we do not observe the typical increase in early germ cells as observed in tumors. Scale bars; 50 μm. PHENOTYPE:
|
|
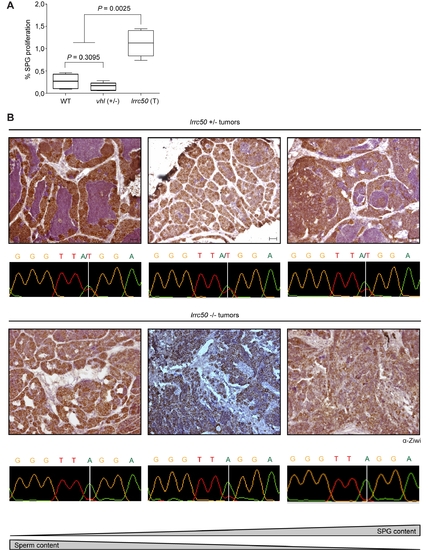
Zebrafish lrrc50Hu255h tumor proliferation and genotyping various stages of tumor progression. (A) Quantification of single stem cell proliferation from phospho-HistoneH3 staining; lrrc50+/ (T; tumors, n = 7), wt (n = 5) and age-matched vhl+/ (n = 4). Statistical analysis was performed using a non-parametric Mann-Whitney test at P<0.05. (B) Analysis of the tumor progression, defined by SPG content determined by α-Ziwi IHC and morphologically identifiable sperm content, correlates with increased biallelic loss indicated by tumor genotypes. Scale bars; 50 μm. |
|
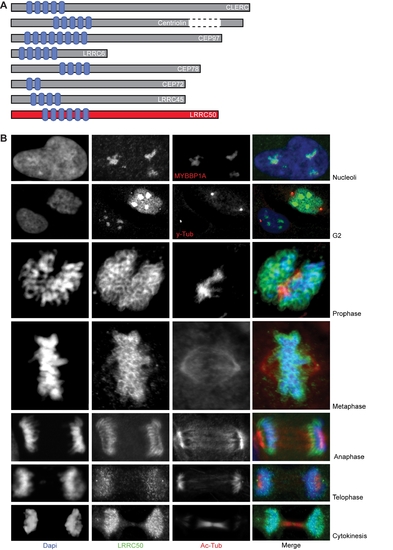
Detailed characterization of human LRRC50. (A) Adapted image from a report by Muto et al. which describes a group of LRR containing proteins that all share localization to the centrosome. Based on the intracellular distribution of LRRC50 described in this manuscript and the presence of six Leucine Rich Repeats as well as a Coiled-Coil domain, we propose LRRC50 to be an additional member of this subgroup. (B) LRRC50 localization resembles that of the group of perichromosomal sheath proteins. A detailed description of the dynamic LRRC50 localization to chromosomes during the cell cycle is provided. Additionally, continuous association of LRRC50 with the centrosomes and localization to the midbody can be appreciated. We used Dapi (blue), α-LRRC50 ab75163 (green) and α-acetylated-α-Tubulin unless otherwise indicated. Nucleolus; in interphase cells, LRRC50 localizes to structures in the nucleus. We show these structures to be nucleoli based on co-localization with ectopically expressed mybbp1A-RFP (red), which is an established nucleolar marker. G2; cells that are in the G2 phase of the cell cycle show increased expression of LRRC50 in both nucleoli and nucleoplasm. One cell with duplicated centrosomes (using α-γ-Tubulin in red) can be observed, indicating this cell to be in the G2 phase. The neighbouring cell has no duplicated centrosomes and appears to be in interphase. Expression levels are generally lower, supported by the LRRC50 mRNA expression shown in Figure 5E and Figure S6C, and localization is confined to nucleoli. Prophase; upon completion of chromosome condensation at the G2/M transition, LRRC50 has associated with all foci of condensed chromosomes. Metaphase and Anaphase; after nuclear envelope breakdown, LRRC50 remains associated with the chromosomes throughout formation of the metaphase plane and the actual chromosome segregation during anaphase. Telophase and cytokinesis; during telophase when condensed chromosomes begin to de-condense, LRRC50 relocalizes from the perichromosomal sheath to a more diffuse and less defined chromosomal location. Followed by a temporal redistribution to the midbody. |

