- Title
-
Control of hematopoietic stem cell emergence by antagonistic functions of ribosomal protein paralogs
- Authors
- Zhang, Y., Duc, A.C., Rao, S., Sun, X.L., Bilbee, A.N., Rhodes, M., Li, Q., Kappes, D.J., Rhodes, J., and Wiest, D.L.
- Source
- Full text @ Dev. Cell
|
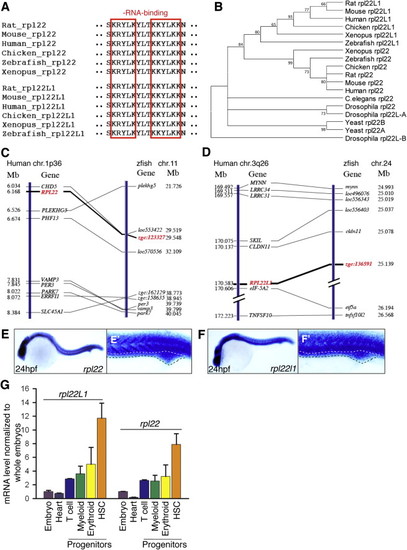
Bioinformatic and Expression Analysis of Zebrafish rpl22 and rpl22l1 (A?D) Sequence alignment of RNA-binding domains, phylogenetic analysis, and synteny analysis. (A) Red-boxed area denotes RNA-binding motif. (B) Numbers on the branches of the phylogenetic tree are bootstrap values. (C) The human (1p36) and zebrafish rpl22 (LG11) loci are flanked by a common set of genes (CHD5, PLEKGH5, PHF13, VAMP3, PER3, PARK7, ERRF11, and SLC45A1). (D) Human (3q26) and zebrafish rpl22l1 (lg24) loci are flanked by a common set of genes (MYNN, LRRC34, LRRC31, SKIL, CLDN11, EIF-5A2, and TNFSF10). Orthologous RPL22 and RPL22L1 gene symbols are in red and bold. (E?F2) Zebrafish rpl22 and rpl22l1 WISH analysis on 24 hpf embryos. (E and F) Lateral views with head to the left. (E2 and F2) Insets depict the ICM region delimited by dashed lines. (G) Real-time PCR quantification of rpl22 and rpl22l1 mRNA levels in hematopoietic progenitor populations. Tg fish lines were employed to identify the following progenitors: (1) heart, cmcl2:EGFP at 2 dpf, (2) T cell, lck:EGFP at 5 dpf, (3) myeloid, mpo:EGFP at 5 dpf, (4) erythroid, gata1:dsRED2 at 5 dpf, and (5) HSC, cd41:EFGP at 3.5 dpf. GFP+ cells were isolated by flow cytometry, after which rpl22 and rpl22l1 expression was measured by real-time PCR. Results of triplicate measurements were normalized to b-actin and whole embryo homogenates and represented graphically as the mean ± SD. The results were combined from at least three separate experiments with representative photographs depicting the observed phenotypes. Unless otherwise specified, all images represent lateral views with the head to the left. See also Figure S1. EXPRESSION / LABELING:
|
|
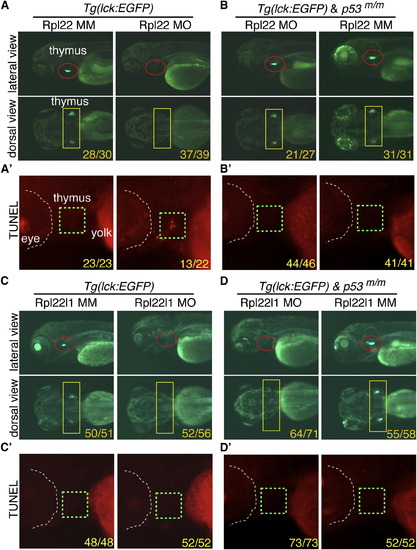
The Arrest of Thymocyte Development in rpl22, but Not rpl22l1, Morphants Is p53-Dependent (A?D2) Knockdown of both Rpl22 and Rpl22l1 arrest T cell development, but the arrest in rpl22l1 morphants is p53-independent. Rpl22 and Rpl22l1 were knocked down in p53-sufficient (A and C) or p53-deficient (p53m/m; B and D) Tg(lck:EGFP) embryos by injection of 1 ng of Rpl22 MO, Rpl22l1 MO, or MM control, after which T cell development was assessed microscopically by scoring for the loss of GFP-marked T cell progenitors at 5 dpf (lateral view, red circles; dorsal view, yellow rectangles). Effects on apoptosis in the thymus (green dashed rectangles) were assessed at 3.5 dpf by TUNEL staining (A2, B2, C2, and D2). Images depict phenotypes representative of at least three separate experiments, with numbers referring to the fraction of morphants with the depicted phenotypes. See also Figure S2. |
|
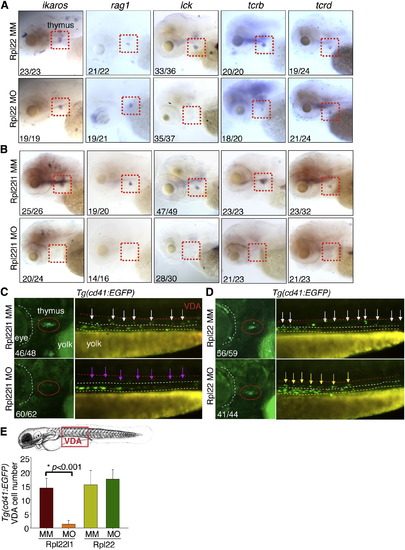
Distinct, Lineage-Restricted Defects in Hematopoiesis in rpl22 and rpl22l1 Morphants (A and B) WISH analysis of thymocyte development with the indicated probes in rpl22 (A) and rpl22l1 morphants (B) at 5 dpf. Thymus, red dashed rectangles. (C?E) Evaluation of thymus colonization and HSC emergence in rpl22l1 and rpl22 morphants. Tg(cd41:EGFP) embryos were injected with Rpl22l1 MO, Rpl22 MO, or MM control, after which seeding of the thymus and HSC emergence was assessed at 3.5 dpf by tracking the presence of GFP+ cells in the thymus (red circles) or VDA (between the red and white dashed lines). Emerging HSC are indicated by arrows. The area between the dashed white and yellow lines is the pronephric duct. The number of CD41-EGFPlow HSCs was quantified in six representative embryos per group and presented as mean ± SD. *p < 0.001. Images depict phenotypes representative of at least three separate experiments, with numbers referring to the fraction of morphants with the depicted phenotypes. See also Figure 3. EXPRESSION / LABELING:
PHENOTYPE:
|
|
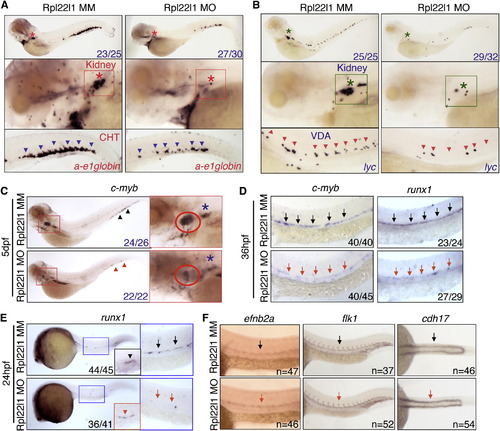
Rpl22l1 Knockdown Blocks HSC Emergence and Definitive Hematopoiesis (A and B) The effect of Rpl22l1 knockdown on development of definitive erythroid (A; a-e1globin) and myeloid (B; lyc) progenitors was assessed by WISH with the indicated probes at 5 dpf in embryos injected with Rpl22l1 MO or MM control. Developing kidney, boxed area and asterisk; CHT, blue arrowheads; VDA, red arrowheads. (C?E) Effect of Rpl22l1 knockdown on c-myb and runx1 expressing progenitors. Embryos were injected with MO as above and evaluated by WISH at 5 dpf (C), 36 hpf (D), and 24 hpf (E) with the indicated probes. Developing kidney (C; red boxed insert, blue asterisk); thymus (C; red boxed inset, red circle); AGM, (D; arrows); AGM (E; blue boxed area, arrows); and erythro-myeloid progenitors (E; EMP, red boxed inset, red arrowhead). (F) Impact of Rpl22l1 knockdown on the vasculature. Dorsal aorta (efnb2a), vasculature (flk1), and pronephros (cdh17) were assessed by WISH in control and rpl22l1 morphant embryos as above with the indicated probes (arrows). Images depict phenotypes representative of at least three separate experiments, with numbers referring to the fraction of morphants with the depicted phenotypes. See also Figure S4. EXPRESSION / LABELING:
|
|
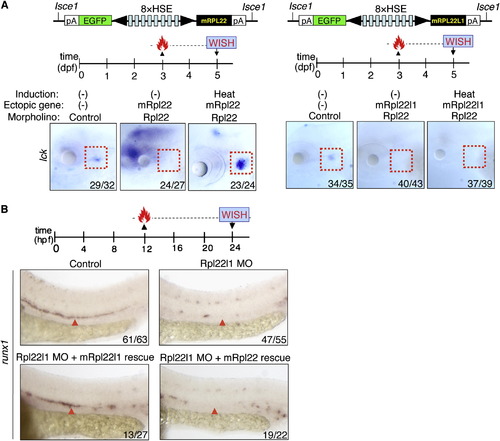
Rpl22 and Rpl22l1 Are Unable to Cross-Compensate Defects Caused by Loss of Their Paralog (A and B) Cross-complementation analysis of the hematopoietic defects caused by knockdown of Rpl22 and Rpl22l1. Embryos injected with Rpl22 MO, Rpl22l1 MO, or MM control were coinjected with the indicated heat-inducible rescue plasmids. Expression of Rpl22/Rpl22l1 was restored by heating for 1 hr at 37°C at either 3 dpf (A) or 12 hpf (B) after which effects on T cell development were assessed by WISH at 5 dpf with an lck probe (A) and effects on HSC emergence were assessed at 24 hpf using a runx1 probe. Thymocytes (A; red dashed rectangles). HSC (B; red arrowheads). Images depict phenotypes representative of at least three separate experiments, with numbers referring to the fraction of morphants with the depicted phenotypes. See also Figures S5. |
|
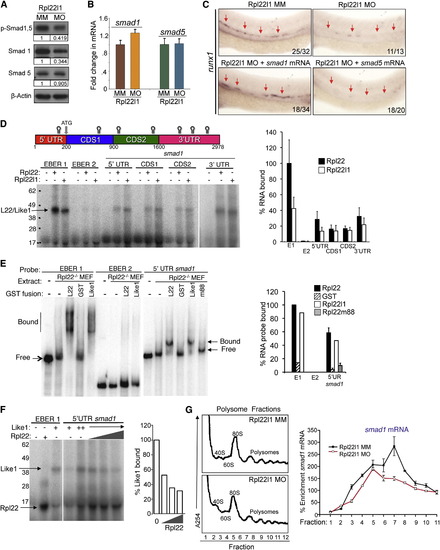
The Blockade of HSC Emergence in rpl22l1 Morphants Results from Reduced Smad1 Expression (A and B) Effect of Rpl22l1 knockdown on Smad expression. The expression levels and phosphorylation of Smad1 and Smad5 were measured by immunoblotting of controls and rpl22l1 morphants at 24 hpf. β-actin was used as a loading control. Band intensity relative to control is indicated. (B) smad1 and smad5 mRNA levels were quantified by real-time PCR and normalized to b-actin, after which the mean ± SD was depicted graphically. (C) Complementation of the arrest in HSC emergence in rpl22l1 morphants by Smad1. The indicated mRNAs (100 pg) were injected in rpl22l1 morphants after which the emergence of HSC was evaluated by WISH using a runx1 probe. Images depict phenotypes representative of at least three separate experiments, with numbers referring to the fraction of morphants with the depicted phenotypes. (D?F) Analysis of binding of smad1 mRNA by Rpl22 and Rpl22l1. (D) Schematic depicting the location in smad1 mRNA of Rpl22/Rpl22l1 binding sites predicted using M-Fold. The indicated radiolabeled mRNA probes were incubated with GST-hRpl22 (Rpl22) or GST-mRpl22l1 (Rpl22l1), after which binding was assessed by RPA. Binding was quantified by phosphorimagery, normalized to the level of Rpl22 binding to EBER1 (E1, positive control), and the mean ± SD depicted graphically (right). EBER2 (E2) served as a negative control. (E) Binding of Rpl22, Rpl22l1, and RNA-binding mutant Rpl22 (m88) to the 52 UTR of smad1 mRNA was assessed by EMSA in which detergent extracts of Rpl22/ MEF were supplemented with the indicated fusion proteins. Positions of bound and free probes are marked. The fraction of bound probe was quantified by phosphorimagery and represented graphically as above. Results represent the mean ± SD of three experiments performed. (F) Rpl22 competes with Rpl22l1 for binding to the 52UTR of smad1 mRNA. RPA analysis was performed with GST-Rpl22l1 as in (D), except that a smaller His-tagged Rpl22 fusion protein was added in increasing amounts to determine if it could displace bound GST-Rpl22l1. The bands corresponding to GST-Rpl22l1 (Like1) and His-Rpl22 (Rpl22) are indicated. The fraction of Rpl22l1 bound to smad1 RNA in the presence of increasing quantities of Rpl22 was quantified and depicted graphically as a fraction of that bound in the absence of Rpl22. (G) Polysome analysis of rpl22l1 morphants. Detergent extracts of 24hpf control (MM) or rpl22l1 morphant embryos were fractionated by ultracentrifugation on a sucrose gradient. The position of monosomes and polysomes was identified by monitoring O.D.254. smad1 RNA content of each fraction was quantified by real-time PCR and normalized to gapdh as well as the level in unfractionated extract, which was defined as 100%. The mean of triplicate samples ± SD is depicted graphically on the right. All results of representative of at least three experiments performed. |
|
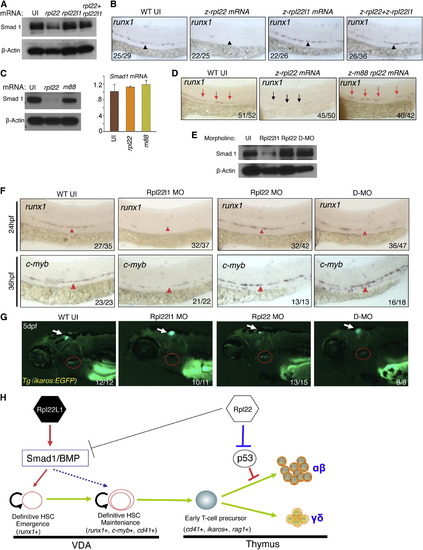
Opposing Roles of Rpl22 and Rpl22l1 in Regulating Smad1 Expression and HSC Emergence (A and B) Effect of Rpl22 and Rpl22l1 overexpression on Smad1 protein levels and HSC emergence. RNA (100 pg) encoding rpl22, rpl22l1, or both were injected into embryos and the effect on Smad1 protein levels assessed by western blotting at 24 hpf (A). β-actin served as a loading control. The effect on HSC emergence in the AGM was assessed by WISH for runx1 at 24 hpf (B). (C and D) Requirement of Rpl22 RNA binding ability in regulating Smad1 expression and HSC emergence. mRNA encoding intact (75 pg) or RNA binding mutant rpl22 (m88) (75 pg) was injected into embryos and the effect on Smad1 protein levels was assessed by blotting at 24 hpf, as above. The effect on smad1 mRNA levels was determined using real-time PCR and the mean ± SD was depicted graphically (C). The effect on HSC emergence was assessed by WISH as above (D). (E?G) Rescue of developmental arrest in rpl22l1 morphants by knockdown of Rpl22. MO targeting Rpl22 (1 ng), Rpl22l1 (1 ng), or the two together (D-MO) were injected into zebrafish embryos, after which Smad1 protein expression was assessed at 24 hpf as above (E). The effect on HSC emergence was assessed by WISH at 24 hpf (runx1) and 36 hpf (c-myb) and the effect on thymus seeding was assessed at 5 dpf using the Tg(ikaros:EGFP) to mark thymic progenitors. VDA (F, red arrowheads); thymus (G, red circle). (H) Model of Rpl22 and Rpl22l1 function in hematopoiesis. Our analysis indicates that Rpl22l1 promotes Runx1 induction and HSC emergence by facilitating Smad1 expression and BMP signaling. The promotion of Smad1 expression by Rpl22l1 is antagonized by Rpl22, perhaps through direct binding of smad1 mRNA. In contrast, Rpl22 is dispensable for the emergence of HSC and consequent seeding of the thymus by progenitors; however, Rpl22 plays a critical role in supporting the development of thymic progenitors after seeding, by suppressing p53 expression in a lineage-restricted manner. Images depict phenotypes representative of at least three separate experiments, with numbers referring to the fraction of morphants with the depicted phenotypes. See also Figure S6. |
|
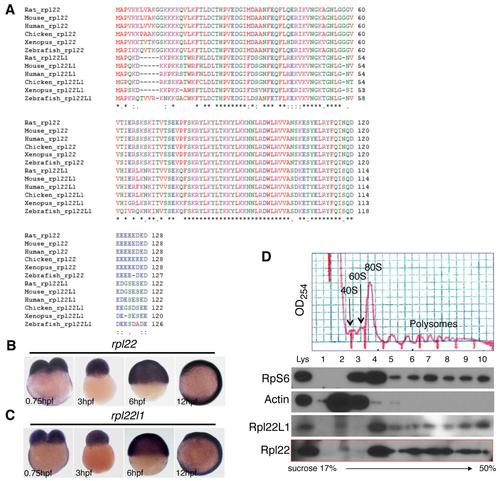
Rpl22 and Rpl22l1 sequence alignments, expression, and association with ribosomes. |
|
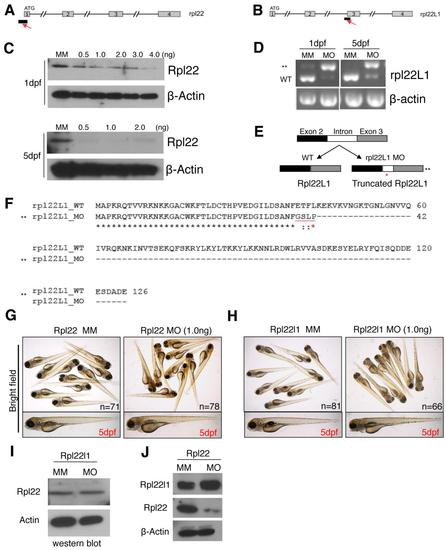
Characterization of the Rpl22 and Rpl22l1 morpholinos. |
|
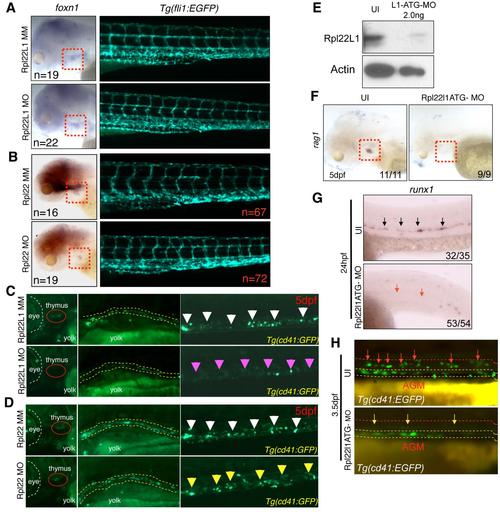
Effects of Rpl22 and Rpl22l1 knockdown on thymic stroma, vasculature, and CD41 marked progenitors. Analysis of a second, start-site Rpl22l1 morpholino. |
|
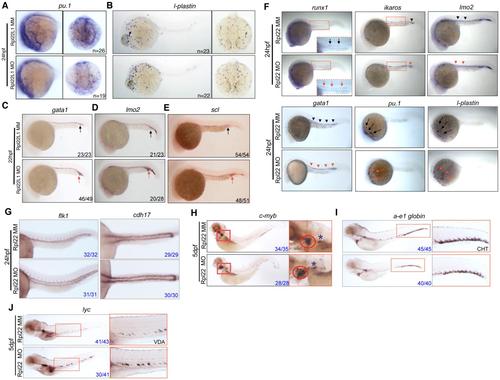
Analysis of the impact of Rpl22l1 knockdown on primitive hematopoiesis and Rpl22 knockdown on definitive hematopoiesis. |
|
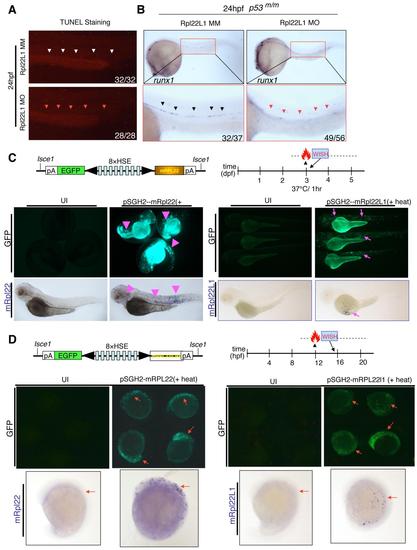
Analysis of the p53-dependency of the arrest in HSC emergence resulting from Rpl22l1 knockdown. Verification of the heat-mediated induction of the Rpl22 and Rpl22l1 expression constructs. |
|
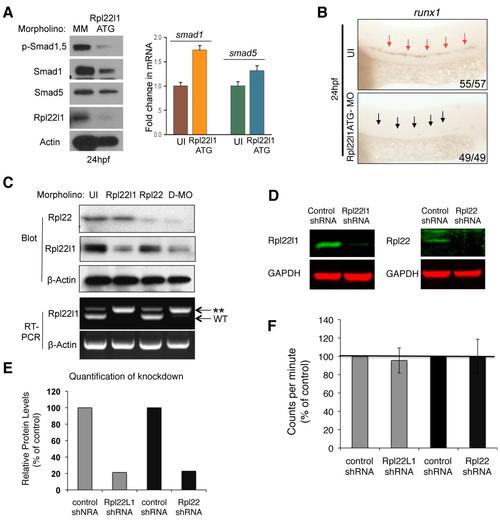
Impairment of HSC emergence by a start site Rpl22l1 morpholino and confirmation that knockdown of Rpl22 and Rpl22l1 is as effective in double morphants as in single morphants. Effect of Rpl22 and Rpl22l1 knockdown on protein synthesis. |
Reprinted from Developmental Cell, 24(4), Zhang, Y., Duc, A.C., Rao, S., Sun, X.L., Bilbee, A.N., Rhodes, M., Li, Q., Kappes, D.J., Rhodes, J., and Wiest, D.L., Control of hematopoietic stem cell emergence by antagonistic functions of ribosomal protein paralogs, 411-425, Copyright (2013) with permission from Elsevier. Full text @ Dev. Cell

