- Title
-
Regenerative Neurogenesis from Neural Progenitor Cells Requires Injury-Induced Expression of Gata3
- Authors
- Kizil, C., Kyritsis, N., Dudczig, S., Kroehne, V., Freudenreich, D., Kaslin, J., and Brand, M.
- Source
- Full text @ Dev. Cell
|
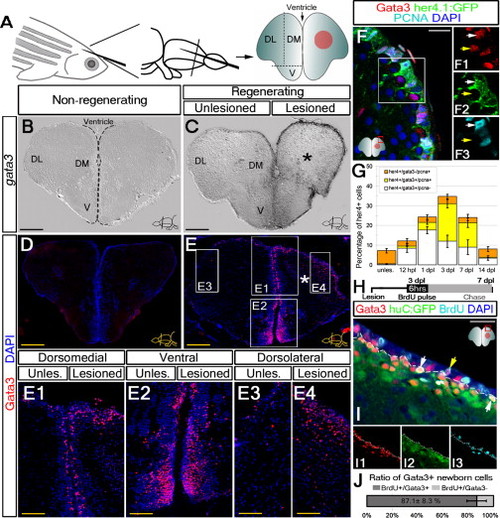
Gata3 Expression in Radial Glia and Newborn Neurons Is Injury Induced (A) Injury paradigm in adult zebrafish telencephalon. DM, dorsomedial; DL, dorsolateral; V, ventral. Red circle is the injury site. (B) gata3 in situ hybridization (ISH) in uninjured adult telencephalon. (C) gata3 expression in the lesioned hemisphere after the stab lesion (*) at 3 dpl. (D) Gata3 immunohistochemistry (IHC) in unlesioned telencephalon. (E) Gata3 IHC on lesioned telencephalons. (E1?E4) High-magnification images from different regions. (F) Gata3-positive cells in the ventricular region colocalize with her4.1:GFP (white arrows). Gata3 is also present in GFP-negative cells in close proximity to the GFP-positive ventricular region (yellow arrows). (F1?F3) Single fluorescence channel of the frame in (F). (G) Time course quantification graph for her4-positive radial glial cells (RGC) in regard to gata3 expression and proliferation. Nonproliferating gata3-positive RGCs, white; proliferating gata3-positive RGCs, yellow; proliferating RGCs that do not express gata3, orange. (H) Experimental scheme for BrdU treatments. (I) Gata3, huC:GFP, BrdU triple IHC. Triple-positive cells, white arrows. BrdU-Gata3 double-positive cells lacking huC:GFP in the ventricular region, yellow arrows. (J) Graph for the ratios for BrdU-Gata3 double-positive and only BrdU-positive cells. Dashed lines indicate the boundary between huC:GFP-negative and positive zones (I?I3). Scale bars: 100 μm (B?E); 50 μm (E1?E4); 20 μm (F and I). n = 8 fish for (B?E4); 4 for (F), 4 for (G), and 5 for (H and J). Data are represented as mean ± SEM. See also Figure S1. EXPRESSION / LABELING:
|
|
Gata3 Is Required for Reactive Cell Proliferation, Reactive Neurogenesis, and Tissue Distribution of Newborn Neurons(A) Morpholino injection paradigm.(B) Gata3 and BrdU IHC for control morpholino-injected brains.(C) High magnification of the framed region in (B).(D) Gata3 and BrdU IHC for Gata3-antisense morpholino-injected brains.(E) High magnification of the framed region in (D).(F) Quantification graph for BrdU-positive cells in the ventricular region of unlesioned and 3 dpl telencephalic hemispheres.(G) BrdU pulse-chase experiment.(H) BrdU IHC on control morpholino-injected brains.(I) BrdU IHC on Gata3 antisense morpholino-injected brains.(J) Quantification graph. Scale bars, 50 μm. n = 7 fish for (B?F) and 4 for (G?J). Data are represented as mean ± SEM.(K) Morpholino-injection and BrdU pulse-chase schemes for reactive neurogenesis assay. (K1?K3) HuC/D-BrdU double IHC on sham/uninjected, control morpholino-injected, and gata3 morpholino-injected telencephalons.(L) Quantification graph.(M) Morpholino-injection and BrdU pulse-chase schemes for reactive neurogenesis assay for PVA neuronal subtype. (M1?M3) PVA-BrdU double IHC on sham/uninjected, control morpholino-injected, and gata3 morpholino-injected telencephalons.(N) Quantification graph.(O) Morpholino-injection and BrdU pulse-chase schemes to assay for migration of newborn neurons. (O1 and O2) HuC/D-BrdU double IHC on control morpholino-injected and gata3 morpholino-injected telencephalons. (O3 and O4) High-magnification images of BrdU staining in framed regions of (E1 and E2). Dashed line is the ventricular surface.(P) Histogram and bar graph depicting the relative distance distribution of HuC/D-BrdU positive newborn neurons from the ventricle and the average distance migrated by a newborn neuron in control- and antisense morpholino-injected telencephalons. Scale bars: 20 μm (K1?K3, insets of M1?M3, O3, and O4) and 50 μm (M1?M3, O1, and O2). n = 8 fish for (K-L), 6 for (M?N), and 4 for (O?P). Data are represented as mean ± SEM.See also Figures S2 and S3, and Tables S1 and S2. PHENOTYPE:
|
|
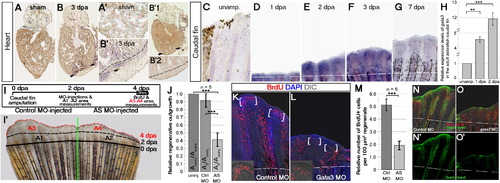
Gata3 Expression Is Injury Induced in Regenerating Heart and Caudal Fin and Is Required for Caudal Fin Regeneration(A) gata3 ISH on sham-operated zebrafish heart. (A′) High-magnification image.(B) gata3 ISH on amputated heart. Amputation plane, black arrows. (B2) High-magnification image. Dashed lines, amputation plane. (B′1) gata3 ISH with the sense probe control on amputated heart. (B′2) High-magnification image from the amputation margin of the heart in (B′1).(C?G) Time course gata3 ISH on adult zebrafish caudal fin: unamputated (C), 1 dpa (D), 2 dpa (E), 3 dpa (F), and 7 dpa (G).(H) Quantitative real-time PCR analyses for gata3 expression on crude lysates of the unamputated, 1 dpa, and 3 dpa caudal fins. Bars represent ± SEM.(I) Experimental scheme for caudal fin outgrowth assay. (I′) A 4 dpa caudal fin. One lobe is injected with control morpholino (Ctrl-MO) and the other with gata3 antisense morpholino (AS-MO) at 2 dpa. A1, Area regenerated between 0?2 dpa in the control lobe before injection. A2, Area regenerated between 0?2 dpa in the AS-MO lobe before injection. A3, Area regenerated between 2?4 dpa after Ctrl-MO injection. A4, Area regenerated between 2?4 dpa after AS-MO injection.(J) Quantification graph for the relative regenerative outgrowth between 2 and 4 dpa compared to uninjected regenerates. Auninj, Area regenerated between 2?4 dpa without injection.(K) BrdU IHC on control MO-injected lobe. Parenthesis indicate the blastema. Inset is a high magnification for the blastema of one fin ray. Bars represent ± SEM.(L) BrdU IHC on gata3 MO-injected lobe. Parenthesis indicate the blastema. Inset is a high magnification for the blastema of one fin ray.(M) Quantification graph for the relative number of BrdU-positive cells in ctrl-MO and AS-MO-injected fins. Scale bars 100 μm; data are represented as mean ± SEM.(N) BrdU-Gata3 double immunostaining shown on DIC image of the fin in (K). (N′) Gata3 staining alone is shown.(O) BrdU-Gata3 double immunostaining shown on DIC image of the fin in (L). (O′) Gata3 staining alone is shown. n = 3 fish for (A?B2), 4 for every set for (C?G), 3 for (H), 6 for (I?J), 4 for (K?M), and 4 for (N?O′). |
|
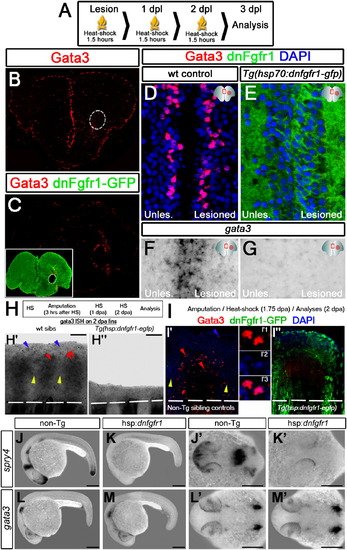
Fgf Signaling Is Required for Injury-Induced Gata3 Expression(A) Heat-shock scheme.(B) Gata3 IHC on 3 dpl heat-shocked sham control fish telencephalon.(C) Gata3 IHC on 3 dpl heat-shocked Tg(hsp:dnfgfr1-gfp) fish telencephalon. Inset: double IHC for GFP and Gata3, showing uniform dnFgfr1-GFP.(D) High magnification from dorsomedial region of (B) with DAPI.(E) High magnification from dorsomedial region of (C) with DAPI.(F) gata3 ISH in heat-shocked control telencephalon at 3 dpl.(G) gata3 ISH in heat-shocked Tg(hsp:dnfgfr1-gfp) telencephalon at 3 dpl. Scale bars 20 μm. n = 4 fish for (B), 6 for (C), 6 for (D and E), and 5 for (F and G). Data are represented as mean ± SEM.(H) Heat-shock and amputation scheme for Tg(hsp70l:dnfgfr1) fish. (H′) gata3 ISH on 2 dpa nontransgenic siblings. (H′′) gata3 ISH on 2 dpa Tg(hsp70:dnfgfr1) fish.(I) Transient and brief heat-shock and amputation scheme for Tg(hsp70l:dnfgfr1) fish. (I2) Gata3 and GFP immunostaining on nontransgenic siblings shown for single fin ray. Dashed lines, amputation margin. (I′1?I′3) Individual fluorescence channel for Gata3, DAPI, and merged image. (I′′) Gata3 and GFP immunostaining on Tg(hsp:dnfgfr1-egfp) animals shown for single fin ray. Dashed lines, amputation margin.(J) spry4 expression at 24 hr postfertilization (hpf) embryo.(K) Blocking Fgf signaling abrogates spry4 expression.(L) gata3 expression at 24 hpf.(M) Blocking Fgf signaling does not alter the expression of gata3. (J′?M′) Dorsal view of animals in (J, K, L, and M), respectively. n = 5 for (H?H′′), 3 for (I?I′′), and more than 50 embryos for (J?M2). Scale bars 200 μm.See also Figure S4. |
|
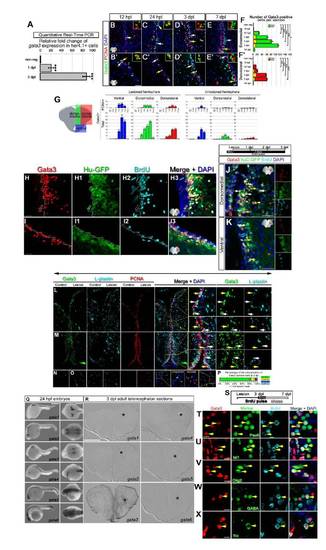
(A) gata3 is significantly upregulated after the injury in her4.1:GFP-positive glia as detected by qRT-PCR on isolated radial glial cells (RGCs). Bars represent ± s.e.m. (B-F′) Gata3 and PCNA double immunostainings for dorsal regions of the adult zebrafish telencephalon. Insets in the panels are high-magnifications of representative cells without DAPI channel. (B-B′) Gata3 is initially seen at 12 hpl at the ventricular region (white arrows). Few cells co-label Gata3 and PCNA (yellow arrows). (C-C′) At 24 hpl, Gata3 cells are similar in location to 12 hpl and slightly more numerous. (D-D′) Gata3 cells are found in both proliferation zones (yellow arrows) and away from the ventricle at the adjacent neuronal layers (white arrows) at 3 dpl. (E-E′) The majority of the Gata3-positive cells are adjacent to the proliferating ventricular cells. (F-F′) Quantification graphs for Gata3-positive cells and their proliferation status in dorsomedial and dorsolateral regions of the lesioned hemisphere (See Suppl. Fig. 4 for unlesioned hemisphere). Scale bars 20 μm. Right sides of ventral and medial panels are injured hemispheres. n = 5 fish per time point, bars are ± s.e.m. (G) Scheme shows the regions analyzed. Graphs show the numbers of Gata3-positive cells in different regions of the lesioned and unlesioned hemispheres. Upper row shows the numbers of Gata3-PCNA double positive cells. Lower row shows the total number of Gata3-positive cells. Bars are ± s.e.m. Asterisks show comparisons to values from non-regenerating brains (left-most bars in each graph section). (H) Gata3 expression in the ventral telencephalon after the injury. (H1) GFP expression driven by the HuC/D promoter (huC:GFP) in the ventral telencephalon after the injury. (H2) BrdU-positive cells in the ventral telencephalon after the injury. (H3) Merge image of A-C. (I) Gata3 expression in the dorsal telencephalon after the injury. (I1) GFP expression driven by the HuC/D promoter in the dorsal telencephalon after the injury. (I2) BrdU-positive cells in the dorsal telencephalon after the injury. (I3) Merge image of E-G. Dashed lines demarcate the HuC/D expression boundaries. (J, K) BrdU-pulse is given 6 hours before the stab-lesion until 3 dpl continuously to label all cells that proliferate upon injury. Triple immunostainings for Gata3, huC:GFP, and BrdU are shown in high-magnification for dorsomedial and ventral regions of the telencephalon. In addition to BrdU-HuC double-positive cells (white arrows), Gata3 is also seen in HuC-positive cells that are BrdU-negative (yellow arrows). (L-O) Triple immunostainings for Gata3, L-Plastin (pan-leukocyte marker) and PCNA shown for dorsomedial (L), ventral (M) and dorsolateral telencephalon (N and O). (P) Quantification graph showing the percentage of total Gata3-positive cells in relation to colocalization with L-plastin and PCNA. A number of Gata3-positive cells scattered along the periventricular region are of myeloid origin as they express L-Plastin (yellow arrows), and a small portion of those are proliferating. Otherwise, Gata3-cells do not colocalize L-plastin (white arrows). The majority (94.2 ± 3.7 %) of Gata3-positive cells are L-Plastin-negative and thus are not the cells of the hematopoietic system. n = 5 fish, bars are ± s.e.m. (Q) In situ hybridization analyses of the expression patterns of the six gata factors ? gata1 to gata6 - at 24 hpf of embryonic development. gata3 is mainly expressed in the otic placode. Other gata factors recapitulate their previously documented in situ expression patterns and show that the RNA probes are functional. (R) In situ hybridization analyses of the expression patterns of gata factors at 3 dpl of regenerating adult zebrafish telencephalon. Only gata3 is detected after the injury. (S) A BrdU-pulse at 3 dpl is followed by a 4-day lag-time. (T-X) Triple immunostainings on 7 dpl brain sections for Gata3 and BrdU with several markers are shown. Cells that are newborn at 3 dpl continue expressing Gata3 as they mature into Pax6- and Isl1-positive neurons (yellow arrows), Olig2-positive cells (yellow arrows), and differentiated neurons such as GABAergic neurons (yellow arrows), and dopaminergic neurons (yellow arrows). Gata3 expression persists in newborn neurons through neuronal differentiation of the telencephalon. Scale bars 10 ¼m. 18 sections from 3 fish were analyzed for each marker. |
|
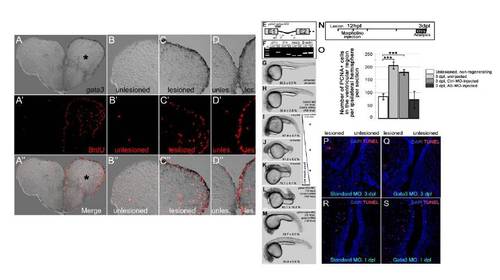
gata3 expression overlaps with cell proliferation at the ventricular region. (A) gata3 in situ hybridization (ISH) on 3 day-post-lesion (dpl) telencephalon section. Asterisk: lesion site. (A′) BrdU immunohistochemistry (IHC) on the same section in a. BrdU was applied for 4 hours before sacrificing the animal. Note the extensive cell proliferation at the ventricular region of the lesioned hemisphere. (A′ ′) Merge image of ISH and IHC. (B-B′ ′) High-magnification image of the dorsolateral part of the unlesioned hemisphere. No reactive cell proliferation is observed. (C-C′ ′) High-magnification image of the dorsolateral part of the lesioned hemisphere. gata3 and BrdU are overlapping and predominantly at the ventricular region. (D-D′ ′) High-magnification image of the dorsomedial part of the telencephalon. Lesioned hemisphere is to the right. Note the dramatic increase in the cell proliferation after lesion. gata3 overlaps to proliferating ventricular cells. (E) The splice-morpholino oligonucleotide targets the first exon-intron boundary of the gata3 pre-mRNA. ef, if, and ir denotes PCR primers for amplifying the retained intron. (F) Unlike control morpholino-injected embryos, gata3-morphants retain the first gata3 intron. Pre-mRNAs of msxb, a transcription factor, and β-actin, a housekeeping gene, are not affected by gata3 splice morpholino. (G) Uninjected control embryos. (H) Control-morpholino- and control mRNA-injected embryos. (I) 5-fmol of splice-blocking gata3 morpholinos causes defective axial patterning. (J) 25-fmol of splice-blocking gata3 morpholinos causes defective axial elongation. (K) 75-fmol of splice-blocking gata3 morpholinos causes dorsalized embryos with defective axial patterning, elongation and head formation. (L) Translation-blocking ATG-morpholino results in dorsalized embryos with defective axial elongation similar to the same-dosage splice-blocking morpholinos. (M) The morphant phenotypes can largely be rescued by co-injection of full-length gata3 mRNA (39.7±9.5 % of the clutch shows axial elongation but smaller heads and defects in yolk-tube extension; 33.2±5.9 % of the clutch shows normal axial elongation and head formation). Scale bars: 250 μm. n e 100 embryos for each category. All embryos are at 24 hpf. (N) Morpholinos were injected at 12 hpl and telencephalons were analyzed at 3 dpl by PCNA immunostaining. (O) Quantification of the number of PCNA-positive cells in the ventricular region of unlesioned and 3 dpl brains ? uninjected, control morpholino-injected and gata3 morpholino-injected. Knocking-down gata3 reduces the number of PCNA-positive cells to control levels. n = 6 fish for every set, bars are ± s.e.m. (P-Q) Knocking down gata3 does not lead to apoptosis. (P) TUNEL staining on 3 dpl telencephalon sections injected with control morpholino. (Q) TUNEL staining on 3 dpl telencephalon sections injected with gata3 antisense morpholino. (R) TUNEL staining on 1 dpl telencephalon sections injected with control morpholino. (S) TUNEL staining on 1 dpl telencephalon sections injected with gata3 antisense morpholino. |
|
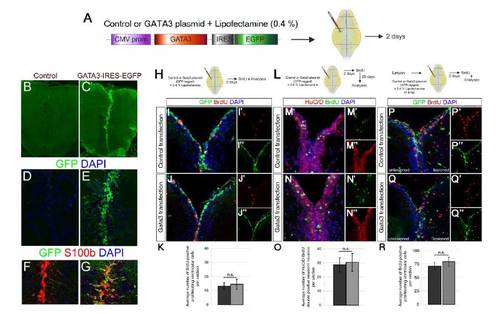
Gata3 is not sufficient to induce regenerative neurogenesis without the lesion. (A) Schematics for lipofectamine-mediated plasmid transfection to ventricular cells of the adult zebrafish telencephalon. CMV promoter drives the expression of Gata3 open reading frame and GFP. Brains were analyzed at 2 days after cerebroventricular microinjection of the plasmids. (B) GFP immunohistochemical (IHC) staining on control plasmid (backbone vector)-transfected brains. (C) GFP IHC on Gata3-GFP plasmid-transfected brains. (D) Close-up to dorsomedial region of B. Counterstained with DAPI. (E) Close-up to dorsomedial region of C. Counterstained with DAPI. (F) GFP, S100b and DAPI staining on control-transfected brains. (G) GFP, S100b and DAPI staining on Gata3-transfected brains. Radial glial cells are effectively transfected. (H) After plasmid transfection, proliferating cells were detected with brief BrdU pulse for two hours before sacrificing the animals. (I) GFP, BrdU and DAPI staining on control-transfected brains. (I′) Individual channel for BrdU. (I′ ′) Individual channel for GFP. (J) GFP, BrdU and DAPI staining on Gata3-transfected brains. (J′) Individual channel for BrdU. (J′ ′) Individual channel for GFP. (K) Quantification graph for average number of BrdU-positive ventricular cells per section. Gata3 transfection does not induce cell proliferation. Bars represent ± s.e.m. (L) After plasmid transfection, a brief BrdU pulse for two hours was given and fish were sacrificed 28 days after BrdU treatment. (M) HuC/D, BrdU and DAPI staining on control-transfected brains. (M′) Individual channel for BrdU. (M′ ′) Individual channel for HuC/D. (N) HuC/D, BrdU and DAPI staining on Gata3-transfected brains. (N′) Individual channel for BrdU. (N′ ′) Individual channel for HuC/D. (O) Quantification graph for average number of newborn neurons per section. Gata3 transfection does not induce neurogenesis. Bars represent ± s.e.m. (P) GFP and BrdU immunostaining coupled to DAPI staining on 2 days post lesion (dpl) brains transfected with control plasmid at 6 hours post lesion (hpl). (P′) Individual channel for BrdU. (P′ ′) Individual channel for GFP. (Q) GFP and BrdU immunostaining coupled to DAPI staining on 2 days post lesion (dpl) brains transfected with Gata3 expression plasmid at 6 hours post lesion (hpl). (Q′) Individual channel for BrdU. (Q′′ ′) Individual channel for GFP. (R) Quantification graph for average number of BrdU-positive ventricular cells per section. Bars represent ± s.e.m. n = 6 fish for every experiment. |
|
(A-A′ ′) Transient and brief block of Fgf signalling reduces gata3 expression significantly. (A) Heat shock and lesion scheme. (A′) gata3 in situ hybridization on adult telencephalic ventricle of the heat-shocked non-transgenic siblings. gata3 expression is strong and seen in ventricular cells. (A′ ′) gata3 in situ hybridization on adult telencephalic ventricle of the heat-shocked Tg(hsp:dnfgfr1-egfp) animals. gata3 expression reduces significantly in the ventricular cells. (B) Hematoxylin and Eosin staining on unlesioned and 3 dpl adult zebrafish brain indicates blood clotting and and tissue remodelling after lesion. At 120 dpl, control morpholino-injected brains display a tissue architecture reminiscent of the unlesioned brain. Gata3 morphant brains also show restored tissue architecture, indicating that Gata3 function at the ventricular region does not affect the gliotic response, which normally resolves quickly to enable regenerative neurogenesis. (C) In intact (unincised) adult zebrafish caudal fin, gata3 is not detectable. gata3 expression is not induced after incision and during wound healing at 6 and 12 hours after incision (hpi). n = 4 fish for A-A′ ′, 6 for every panel in B, 3 for every panel in C. |
Reprinted from Developmental Cell, 23(6), Kizil, C., Kyritsis, N., Dudczig, S., Kroehne, V., Freudenreich, D., Kaslin, J., and Brand, M., Regenerative Neurogenesis from Neural Progenitor Cells Requires Injury-Induced Expression of Gata3, 1230-1237, Copyright (2012) with permission from Elsevier. Full text @ Dev. Cell

