
|
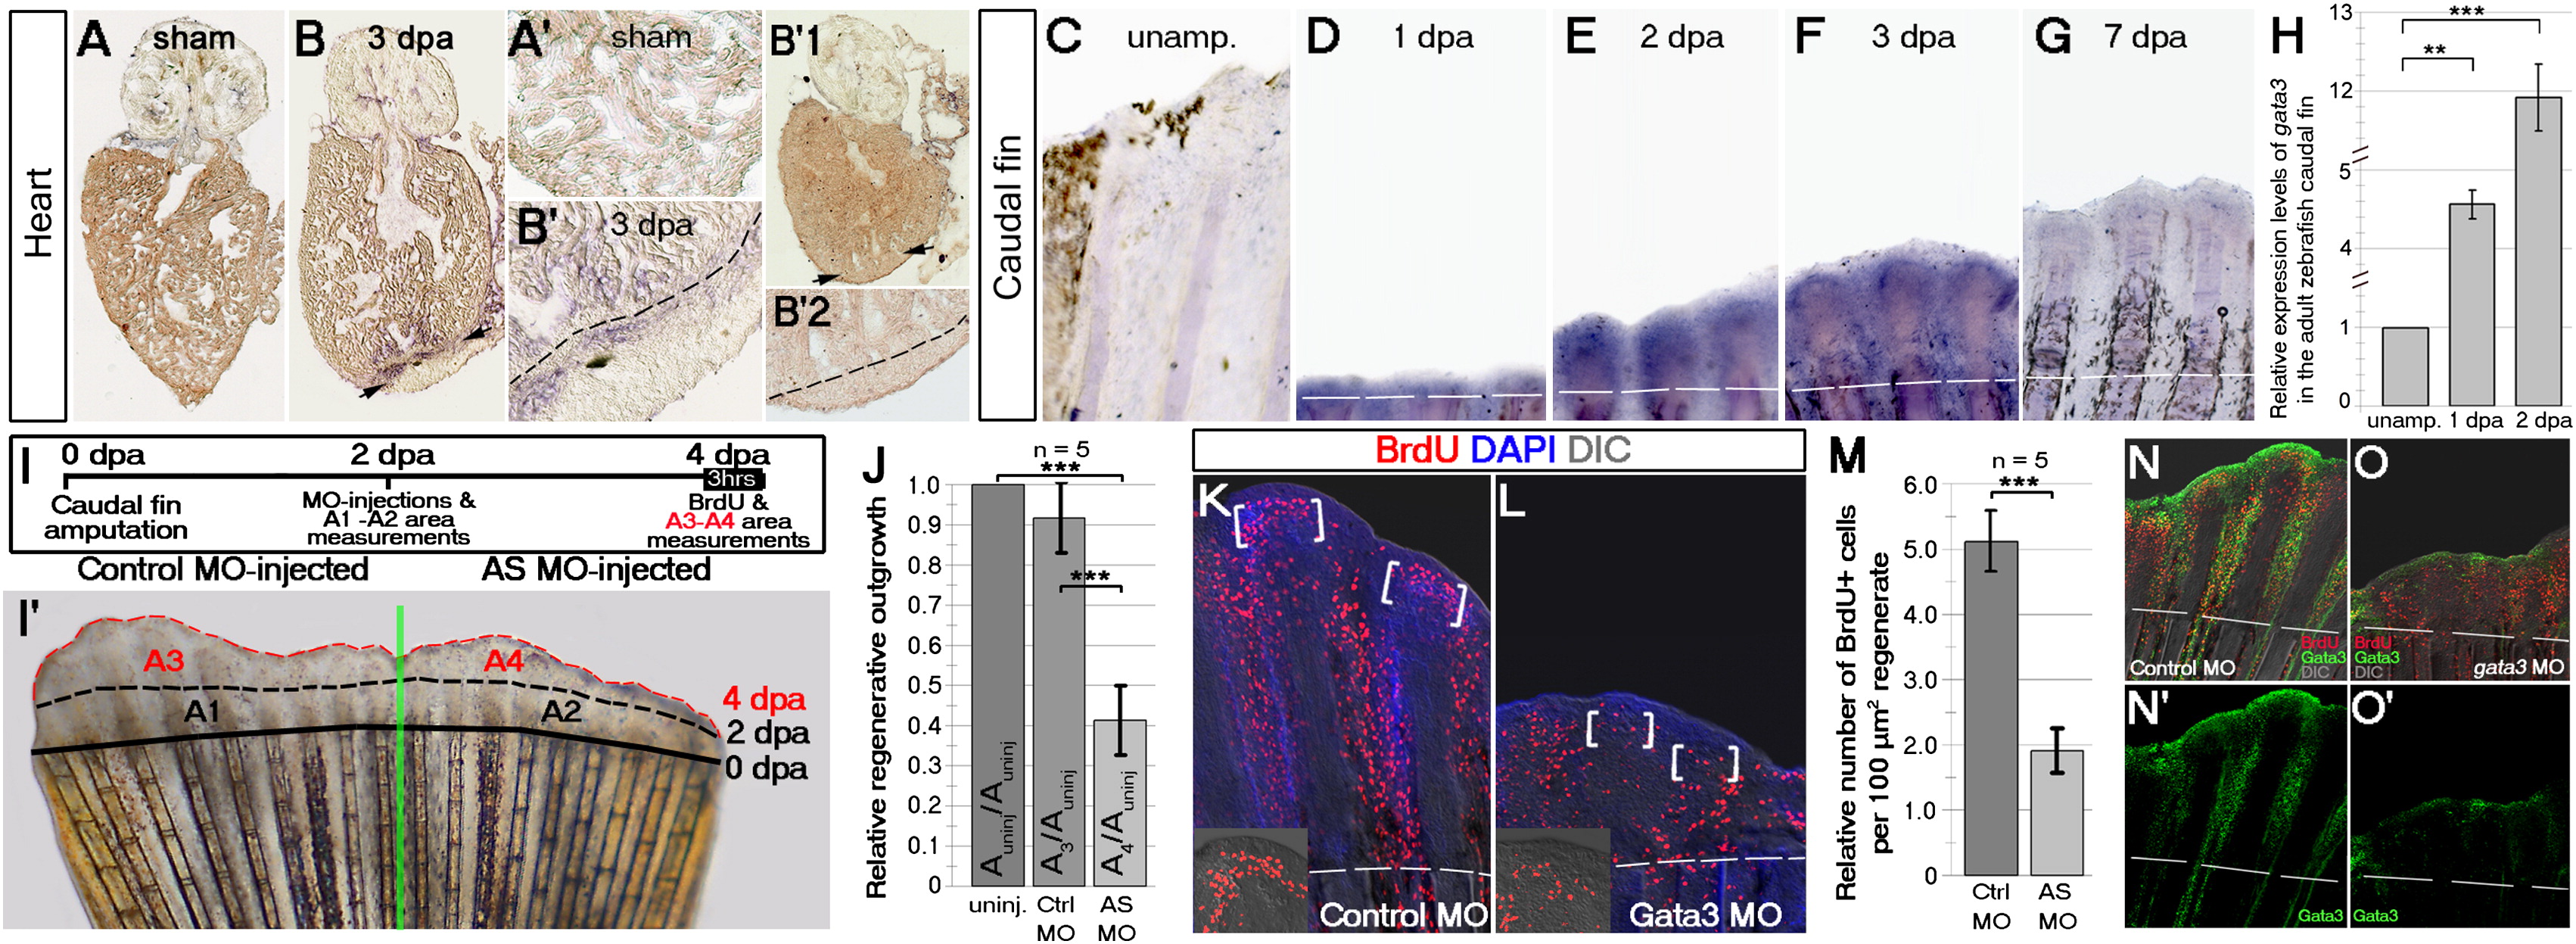
Fig. 3 Gata3 Expression Is Injury Induced in Regenerating Heart and Caudal Fin and Is Required for Caudal Fin Regeneration(A) gata3 ISH on sham-operated zebrafish heart. (A′) High-magnification image.(B) gata3 ISH on amputated heart. Amputation plane, black arrows. (B2) High-magnification image. Dashed lines, amputation plane. (B′1) gata3 ISH with the sense probe control on amputated heart. (B′2) High-magnification image from the amputation margin of the heart in (B′1).(C?G) Time course gata3 ISH on adult zebrafish caudal fin: unamputated (C), 1 dpa (D), 2 dpa (E), 3 dpa (F), and 7 dpa (G).(H) Quantitative real-time PCR analyses for gata3 expression on crude lysates of the unamputated, 1 dpa, and 3 dpa caudal fins. Bars represent � SEM.(I) Experimental scheme for caudal fin outgrowth assay. (I′) A 4 dpa caudal fin. One lobe is injected with control morpholino (Ctrl-MO) and the other with gata3 antisense morpholino (AS-MO) at 2 dpa. A1, Area regenerated between 0?2 dpa in the control lobe before injection. A2, Area regenerated between 0?2 dpa in the AS-MO lobe before injection. A3, Area regenerated between 2?4 dpa after Ctrl-MO injection. A4, Area regenerated between 2?4 dpa after AS-MO injection.(J) Quantification graph for the relative regenerative outgrowth between 2 and 4 dpa compared to uninjected regenerates. Auninj, Area regenerated between 2?4 dpa without injection.(K) BrdU IHC on control MO-injected lobe. Parenthesis indicate the blastema. Inset is a high magnification for the blastema of one fin ray. Bars represent � SEM.(L) BrdU IHC on gata3 MO-injected lobe. Parenthesis indicate the blastema. Inset is a high magnification for the blastema of one fin ray.(M) Quantification graph for the relative number of BrdU-positive cells in ctrl-MO and AS-MO-injected fins. Scale bars 100 μm; data are represented as mean � SEM.(N) BrdU-Gata3 double immunostaining shown on DIC image of the fin in (K). (N′) Gata3 staining alone is shown.(O) BrdU-Gata3 double immunostaining shown on DIC image of the fin in (L). (O′) Gata3 staining alone is shown. n = 3 fish for (A?B2), 4 for every set for (C?G), 3 for (H), 6 for (I?J), 4 for (K?M), and 4 for (N?O′).
Reprinted from Developmental Cell, 23(6), Kizil, C., Kyritsis, N., Dudczig, S., Kroehne, V., Freudenreich, D., Kaslin, J., and Brand, M., Regenerative Neurogenesis from Neural Progenitor Cells Requires Injury-Induced Expression of Gata3, 1230-1237, Copyright (2012) with permission from Elsevier. Full text @ Dev. Cell