- Title
-
sox9b Is a Key Regulator of Pancreaticobiliary Ductal System Development
- Authors
- Delous, M., Yin, C., Shin, D., Ninov, N., Debrito Carten, J., Pan, L., Ma, T.P., Farber, S.A., Moens, C.B., and Stainier, D.Y.
- Source
- Full text @ PLoS Genet.
|
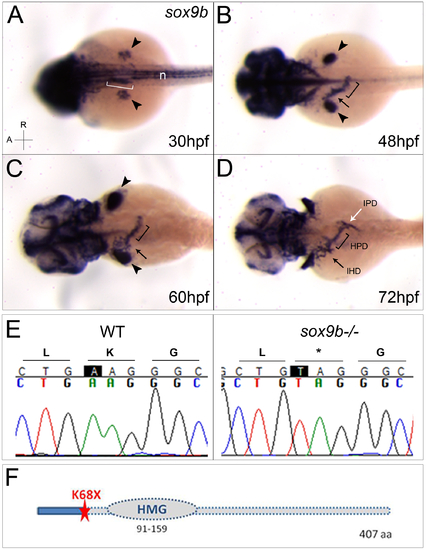
sox9b is expressed in the pancreaticobiliary ductal system, and the sox9bfh313 lesion is a nonsense mutation. (A?D) sox9b expression is observed in the head and fin buds (arrowheads in A?C), as well as the notochord (n) and part of the foregut endoderm (bracket) at 30 hpf (A). At 48 hpf, sox9b expression is observed in the liver bud (arrow) and hepatopancreatic duct primordium (bracket) (B). At 60 hpf, sox9b expression covers the intra- (arrow) and extrahepatic (bracket) ducts (C), and extends to the intrapancreatic ducts by 72 hpf (white arrow, D). Dorsal views, anterior (A) to the left. (E) Genomic DNA sequence of wild-type (left panel) and sox9bfh313 mutant (right panel) showing an A>T transversion at position 302 of the coding sequence. This mutation leads to a stop codon at amino acid Lys68. (F) Schema of Sox9b depicting the localization of the amino acid affected by the fh313 mutation leading to a stop codon upstream of the HMG box DNA-binding domain. IPD, intrapancreatic duct; IHD, intrahepatic duct; HPD, hepatopancreatic duct; HMG, high-mobility group; aa, amino acid. EXPRESSION / LABELING:
|
|
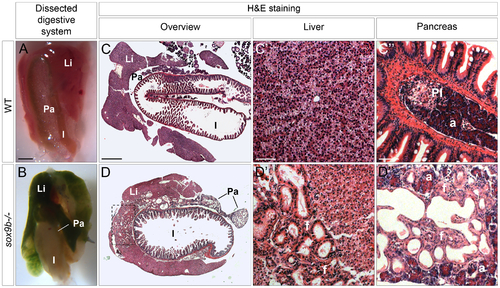
Adult sox9b mutants develop cholestasis associated with fibrosis, duct proliferation, and dilation in both the liver and pancreas. (A?B) Dissection of the digestive system of 5 month-old wild-type (A) and sox9b homozygous mutant (B) fish reveals a green mutant liver and pancreas reflecting the accumulation of bile in both organs. Anterior to the top. (C?D) Hematoxylin-and-eosin (H&E) staining of histological cross-sections of wild-type (C) and sox9b mutant (D) digestive tracts shows abnormal duct morphology in the mutant liver and pancreas. These duct malformations are focalized around the connection with the extrahepatic duct (dashed rectangle in D) in the liver, whereas they are spread over the entire pancreas. Higher magnifications of liver (C′?D′) and pancreas (C′′?D′′) reveal dilated ducts surrounded by fibrotic tissue (pink staining in D3 labeled as ?f?) in both organs in sox9b mutants. Li, liver; Pa, pancreas; I, intestine; PI, primary islet; a, acinar compartment. Scale bars, 1 mm in A?B; 500 μm in C?D; 50 μm in C′?D′′. PHENOTYPE:
|
|
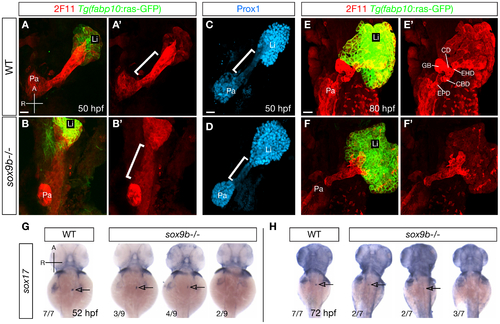
sox9b mutants display defective HPD patterning during organ development. (A?B) Labeling for the hepatocyte marker Tg(fabp10:ras-GFP) (green) and the HPD marker 2F11 (red) in wild-type and sox9b mutant embryos at 50 hpf. 2F11 labeling in the HPD primordium is noticeably reduced in sox9b mutants. (A′?B′) Same views as (A?B), but only showing the 2F11 immunostaining. (C?D) In wild-type, Prox1 expression marks the liver and pancreas and is largely absent from the HPD primordium (C). In contrast, Prox1 is abnormally expressed in the HPD primordium in sox9b mutants (D). (A′?B′, C?D) Brackets mark the HPD primordium. (E) By 80 hpf, different compartments of the HPD system, including the cystic duct (CD), common bile duct (CBD), gallbladder (GB), extrahepatic duct (EHD) have become evident in wild-type. (F) In sox9b mutants, the HPD system is dysmorphic and its compartments are indistinguishable based on morphology. The gallbladder is also often missing. (E′?F′) Same views as (E?F), but only showing 2F11 immunostaining. (G?H) Whole-mount in situ hybridization showing sox17 expression in the gallbladder primordium in wild-type and sox9b mutants at 52 (G) and 72 (H) hpf. sox17 expression is greatly reduced or absent in sox9b mutants. The proportion of mutants showing the corresponding phenotype is indicated. Arrows point to the gallbladder primordium. (A?F, A′?F′) All images are projections of confocal z-stacks. Ventral views. (G?H) Dorsal views. Anterior (A) to the top. Pa, pancreas; Li, liver; EPD, extrapancreatic duct. Scale bars, 20 μm. EXPRESSION / LABELING:
PHENOTYPE:
|
|
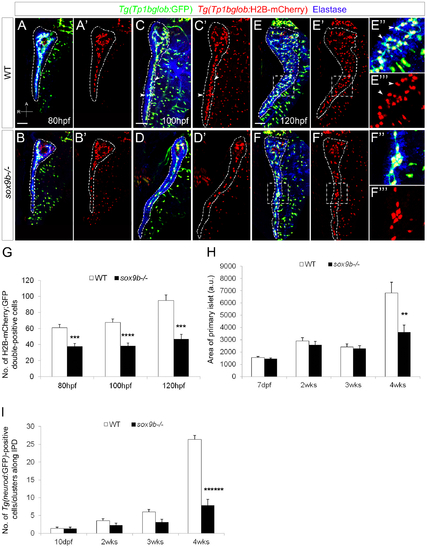
sox9b mutant larvae fail to form a complex intrapancreatic ductal network. (A?F) Confocal images of Tg(Tp1bglob:GFP);Tg(Tp1bglob:H2B-mCherry ) wild-type (top row) and sox9b mutant (bottom row) pancreata at 80 (A,B), 100 (C,D) and 120 (E,F) hpf. Elastase antibody staining (blue) labels acinar cells. Although acinar and endocrine tissues appear morphologically unaffected in sox9b mutants (data not shown), the intrapancreatic ductal network is less complex and secondary branches are missing in the mutants (D?D′) whereas they start to form by 100 hpf in wild-type larvae (arrowheads and insets, C?C′). (E′ ′′?F′ ′′) Higher magnifications of the area marked by dashed squares in (E?F′) show that at 120 hpf the main duct forms secondary branches (arrowheads) in wild-type larvae (E′′?E′ ′′), whereas in the mutants, secondary branches remain absent and clusters of ductal cells are sometimes observed (F′′?F′ ′′). (A?F) All images are projections of confocal z-stacks. Ventral views, anterior (A) to the top. Scale bars, 50 μm. (G) Graph representing the number of Tg(Tp1bglob:GFP);Tg(Tp1bglob:H2B-mCherry)-double positive cells (averageħSEM) in the intrapancreatic ducts of wild-type and sox9b mutant larvae at different time points. 7 to 11 larvae of each genotype were counted at each stage. (H) Graph representing the area (in arbitrary unit, a.u.) of the primary islet (averageħSEM) of TgBAC(neurod:GFP) wild-type and sox9b mutant larvae (7 dpf) and juvenile animals (2, 3 and 4 weeks (wks)). 6 to 11 animals of each genotype were analyzed at each stage. Area of primary islet was determined using ImageJ. (I) Graph representing the number of TgBAC(neurod:GFP)-positive cells/clusters (averageħSEM) along the intrapancreatic ducts (IPD) in wild-type and sox9b mutant larvae (10 dpf) and juvenile animals. 7 to 11 animals of each genotype were analyzed at each stage. Asterisks indicate statistical significance: *p<0.05; PHENOTYPE:
|
|
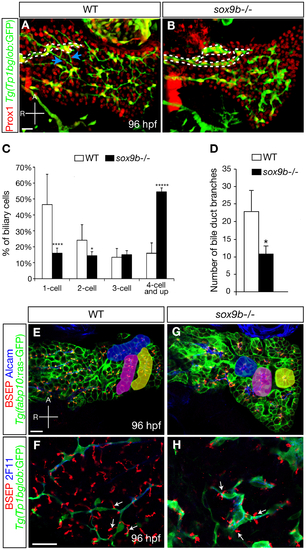
Intrahepatic biliary network morphogenesis and bile canaliculi formation are impaired in sox9b mutants. (A?B) Distribution of hepatocytes and biliary cells in 96 hpf wild-type and sox9b mutant larvae as revealed by Prox1 (red) and Tg(Tp1bglob:GFP) (green) expression. In wild-type, the cell bodies of biliary cells are separated from one another and interconnected via cellular processes (A). In sox9b mutants, the biliary cells are clustered together (B). Dashed lines mark the long bile ducts and arrows in (A) point to the short interconnecting ducts that are missing in the mutants. (C) Percentage (averageħSEM) of biliary cells that exist as single cells, doubles, triples, or clusters of four or more at 96 hpf. 6 wild-type and 6 sox9b mutant larvae were analyzed. (D) Number (averageħSEM) of branching points observed along the bile ducts per liver. 7 wild-type and 7 mutants were analyzed. (C?D) Asterisks indicate statistical significance: *p<0.05; ****p<0.0001; *****p<0.00001. (E, G) Wild-type and sox9b mutant livers stained for BSEP (red) which marks the canaliculi, Alcam (blue) which marks the apical side of the hepatocytes, and Tg(fabp10:ras-GFP) (green) which labels the hepatocytes. The hepatocytes in wild-type livers are organized in parallel arrays (highlighted by pseudo-colors), while the sox9b mutant hepatocytes are arranged in rosettes (highlighted by pseudo-colors). (F, H) High magnification confocal images showing the morphology of biliary cells and bile canaliculi. The canaliculi (arrows) in sox9b mutant livers appear shorter and wider compared to wild-type. (A?B) All images are projections of confocal z-stacks. (E?H) Single confocal plane images. (A?B, E?H) Ventral views, anterior (A) to the top. Scale bars, 20 μm. PHENOTYPE:
|
|
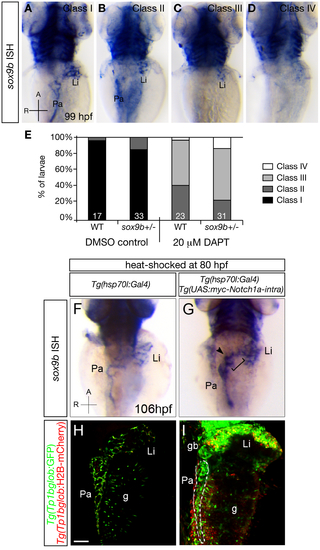
Notch signaling regulates sox9b expression in the intrahepatic and intrapancreatic ducts. (A?D) Whole-mount in situ hybridization (ISH) showing sox9b expression in larvae obtained from a wild-type to sox9b heterozygote cross that were treated with DMSO control or 20 μM DAPT between 75 and 99 hpf. In DMSO-treated controls, sox9b was strongly expressed in the liver and pancreas at 99 hpf (A, Class I). In animals treated with 20 µM DAPT (B?D), some showed a slight reduction of sox9b expression in the liver (Li) and pancreas (Pa) (B, Class II), others only retained expression of sox9b in the liver (C, Class III), and the remaining ones did not exhibit any obvious expression of sox9b in either organ (D, Class IV). Dorsal views, anterior (A) to the top. (E) Percentages of larvae showing different classes of phenotypes. sox9b heterozygotes exhibited a more severe reduction in sox9b expression than wild-type upon DAPT treatment. The numbers of larvae analyzed are indicated at the bottom. (F?I) Larvae obtained from crossing Tg(hsp70l:Gal4);Tg(UAS:myc-Notch1a-intra) hemizygous and Tg(Tp1bglob:GFP);Tg(Tp1bglob:H2BmCherry) parents were heat-shocked at 80 hpf to induce myc-Notch1a-intra expression and fixed 26 hours later. (myc-Notch1a-intra)-overexpressing larvae were selected based on the increased expression of both Tg(Tp1bglob:GFP) and Tg(Tp1bglob:H2BmCherry), and their genotype was confirmed by anti-myc antibody labeling (data not shown). (F?G) in situ hybridization showed an increased expression of sox9b in the liver (Li) and pancreas (Pa) as well as in the HPD system (bracket) including the gallbladder (arrowhead) in (myc-Notch1a-intra)-overexpressing larvae (G) compared to (myc-Notch1a-intra)-negative siblings (F). 10 larvae of each genotype were analyzed. Dorsal views, anterior (A) to the top. (H?I) Confocal images of (myc-Notch1a-intra)-negative (H) and (myc-Notch1a-intra)-overexpressing (I) larvae showing elevated expression of Tg(Tp1bglob:GFP) and Tg(Tp1bglob:H2BmCherry) in the liver (Li), pancreas (Pa), gut (g) and gallbladder (gb) in (myc-Notch1a-intra)-overexpressing larvae after heat-shock. Dashed lines in (I) mark the pancreas. All images are projections of confocal z-stacks. Ventral views, anterior (A) to the top. Scale bars, 50 μm. EXPRESSION / LABELING:
|
|
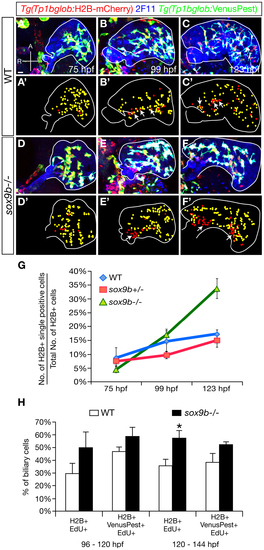
The pattern of Notch signaling activity is altered in sox9b mutants. (A?F) Expression of Tg(Tp1bglob:H2B-mCherry) (red), 2F11 (blue), and Tg(Tp1bglob:VenusPest) (green) in wild-type (A?C) and sox9b mutant (D?F) larvae at 75 (A, D), 99 (B, E), and 123 hpf (C, F). At each time point, 6 larvae of each genotype were analyzed. (A2?F2) Diagrams showing the distribution of Tg(Tp1bglob:H2B-mCherry);Tg(Tp1bglob:VenusPest)-double positive cells (yellow) and Tg(Tp1bglob:H2B-mCherry)-single positive cells (red) in (A?F). Livers are outlined by solid white line. In wild-type livers, expression of Tg(Tp1bglob:H2B-mCherry) and Tg(Tp1bglob:VenusPest) largely overlaps at 75 hpf (A, A′). At 99 and 123 hpf (B?B′, C?C′), a few Tg(Tp1bglob:H2B-mCherry)-single positive cells (arrows) appear along the intrahepatic duct that connects to the extrahepatic system. In sox9b mutants, Tg(Tp1bglob:H2B-mCherry);Tg(Tp1bglob:VenusPest)-double positive cells and Tg(Tp1bglob:H2B-mCherry)-single positive cells show similar distribution as in wild-type at 75 and 99 hpf (D?D′, E?E′). However, at 123 hpf (F, F′), we observed big clusters of Tg(Tp1bglob:H2B-mCherry)-single positive cells in the mutant livers (arrows). (G) Percentages (averageħSEM) of Tg(Tp1bglob:H2B-mCherry)-single positive cells relative to the total number of Tg(Tp1bglob:H2B-mCherry)-expressing cells. Whereas wild-type and sox9b heterozygous livers contained similar percentages of Tg(Tp1bglob:H2B-mCherry)-single positive cells at all stages examined (p>0.4), this percentage was significantly higher in sox9b mutants at 123 hpf (p<0.0005). (H) Percentages (averageħSEM) of Tg(Tp1bglob:H2B-mCherry)-single positive cells or Tg(Tp1bglob:H2B-mCherry);Tg(Tp1bglob:VenusPest)-double positive cells that were labeled by EdU. EdU incubation was conducted from 96 to 120 hpf or from 120 to 148 hpf. Under both conditions, the hepatic Notch responsive cells in sox9b mutants showed higher EdU incorporation compared to wild-type, and the difference was more pronounced for Tg(Tp1bglob:H2B-mCherry)-single positive cells. 7 wild-types and 7 sox9b mutants were examined for each experimental condition. Asterisks indicate statistical significance: *, p<0.05. (A?F) All images are projections of confocal z-stacks. Ventral views, anterior (A) to the top. Scale bar, 20 μm. EXPRESSION / LABELING:
PHENOTYPE:
|
|
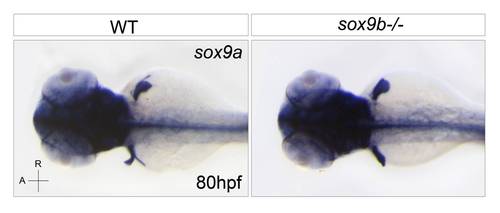
sox9a in situ hybridization in wild-type and sox9b mutant larvae at 80 hpf. sox9a does not appear to be expressed in endodermal tissues in wild-type or sox9b mutant animals. Dorsal views, anterior (A) to the left. |
|
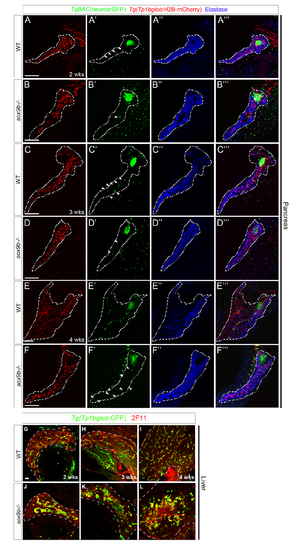
Time course analyses of the pancreas (A?F) and liver (G?L) in wild-type and sox9b mutant larvae at 2, 3, and 4 weeks. (A?F) Tg(Tp1bglob:H2B-mCherry);TgBAC(neurod:GF P) double transgenic fish from sox9b heterozygote incrosses were raised together and 40 of them were fixed and genotyped at each time point. The pancreas, along with the gut, of 6 to 11 wild-type or sox9b homozygous mutant fish were dissected, stained with anti-dsRed (red), anti-GFP (green) and anti-Elastase (blue) antibodies and mounted for confocal imaging. Whereas wild-type pancreata showed complex intrapancreatic duct networks at 2 and 3 weeks of age with several main pancreatic ducts (A, C), sox9b mutant pancreata failed to expand and ductal cells stayed in clusters (B, D). At 4 weeks of age, the morphological differences between wild-type and sox9b mutant pancreata were even more obvious: wild-type pancreata spread over the gut starting to form lobes whereas sox9b mutant pancreata were still primitive in appearance (E, F). The defect in pancreatic growth in sox9b mutant fish is associated with a global growth retardation of the fish as indicated by the smaller size of the fish and the frequent occurrence of an unlooped gut at 4 weeks (data not shown). In addition to pancreatic duct morphological defects, sox9b mutant fish showed a deficiency in secondary islet formation as assessed by TgBAC(neurod:GFP) expression (arrowheads in B2, D2, F2). However, at the equivalent stages, wild-type fish exhibited multiple clusters of TgBAC(neurod:GFP)-positive cells along the intrapancreatic ducts (arrowheads in A2, C2). All images are projections of confocal z-stacks. Ventral views, anterior to the top right. Dashed lines delineate the pancreas. Scale bars, 100 μm. (G?L) Wild-type and mutant larvae were sorted at 5 dpf based on their intrahepatic ductal system phenotypes (as assessed by the pattern of Tg(Tp1bglob:GFP) expression) and raised separately. At 2 (G, J), 3 (H, K), and 4 weeks (I, L) of age, 2 wild-type and 2 mutant fish were fixed for immunostaining. Cryosections were stained with 2F11 (red) and anti-GFP (green) antibodies. In the liver, whereas the intrahepatic biliary network continued to expand between 2 and 4 weeks in wild-types (G?I), the biliary cells in sox9b mutants remained clustered and never assumed normal morphogenesis (J?L). Moreover, the expression of Tg(Tp1bglob:GFP) largely overlapped with 2F11 labeling in wild-type livers (G?I). In contrast, in sox9b mutant livers, we observed an increasing number of cells that were labeled by 2F11, but did not express Tg(Tp1bglob:GFP) (J?L). These cells formed large clusters by 4 weeks of age (L). All images are projections of confocal z-stacks. Sagittal sections, anterior to the top. Dashed lines in (G?L) delineate the liver. Li, liver; Pa, pancreas. Scale bar, 20 μm. |
|
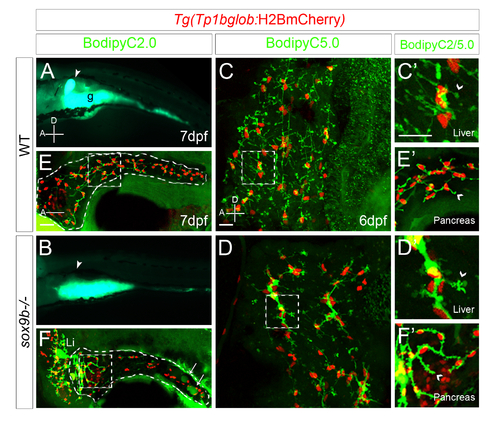
sox9b mutants show defects in bile secretion and transport as assessed by BODIPY-FL analog feeding. (A?B) Fluorescent micrographs of 7 dpf live wild-type (A) and sox9b mutant (B) larvae after BODIPY feeding showing lack of filling of the gallbladder (arrowhead) in sox9b mutants (B). Lateral views, anterior (A) to the left. (C?F) Confocal images of Tg(Tp1bglob:H2B-mCherry) wild-type (upper panel) and sox9b mutant (lower panel) larvae showing morphological and functional defects of both intrahepatic (D) and intrapancreatic (F) ductal networks compared to wild-type (C and E). In the mutants, both intrahepatic and intrapancreatic ducts appear to be dilated (D and F). Fluids (bile or pancreatic juice) also appear to accumulate in the pancreatic tail (arrows, F). Dashed squares represent areas shown in higher magnification for intrahepatic (C′?D′) and intrapancreatic (E2?F2) ducts in wild-types (upper panel) and sox9b mutants (lower panel). sox9b mutants showed defects in bile canaliculi (comparing arrowheads in C′, D′) and terminal pancreatic ducts (comparing arrowheads in E′, F′). 9 larvae were analyzed for each genotype. (C?F) All images are projections of confocal z-stacks. (C?F) Lateral views, anterior (A) to the left. Dashed lines in E and F outline the pancreas. g, gut; Li, liver. Scale bars, 20 μm. |
|
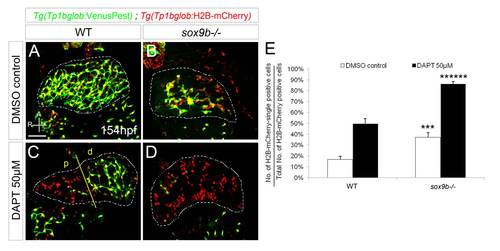
The intrahepatic biliary cells in sox9b mutants are more susceptible to Notch signaling inhibition. (A?D) Confocal images of livers in Tg(Tp1bglob:VenusPest); Tg(Tp1bglob:H2B-mCherry) wild-type (A, C) and sox9b mutant (B, D) larvae treated with DMSO (A?B) or 50 μM DAPT (C?D) from 106 to 154 hpf. DAPT treatment caused an increase in the relative proportion of Tg(Tp1bglob:H2B-mCherry)-single positive cells in all the animals, yet sox9b mutants exhibited a more severe increase compared to wild-type larvae. In DAPT-treated wild-type larvae (C), loss of Notch activity was more prominent in the region proximal to the extrahepatic duct (p, left side of yellow line), whereas the distal biliary cells still maintained Tg(Tp1bglob:VenusPest) expression (d, right side of the yellow line). (A?D) All images are projections of confocal z-stacks. Ventral views, anterior (A) to the top. Dashed lines outline the liver. Scale bar, 50 μm. (E) Percentages (averageħSEM) of Tg(Tp1bglob:H2B-mCherry)-single positive cells relative to the total number of Tg(Tp1bglob:H2B-mCherry)-expressing cells. 10 DMSO control and 14 DAPT-treated larvae were analyzed for each genotype. Asterisks indicate statistical significance compared to equally-treated wild-type larvae: ***, p<0.005; ******, p<0.000005. |

Unillustrated author statements PHENOTYPE:
|

