
Fig. 4
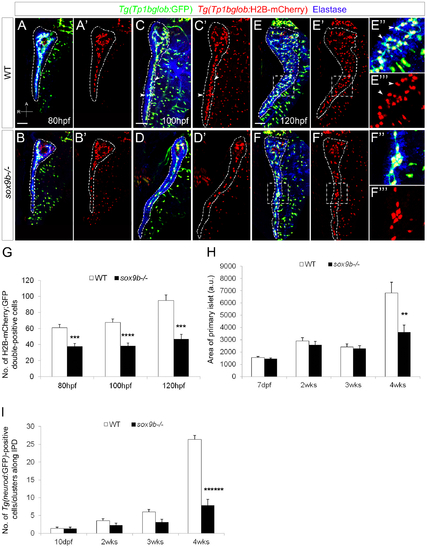
sox9b mutant larvae fail to form a complex intrapancreatic ductal network. (A?F) Confocal images of Tg(Tp1bglob:GFP);Tg(Tp1bglob:H2B-mCherry ) wild-type (top row) and sox9b mutant (bottom row) pancreata at 80 (A,B), 100 (C,D) and 120 (E,F) hpf. Elastase antibody staining (blue) labels acinar cells. Although acinar and endocrine tissues appear morphologically unaffected in sox9b mutants (data not shown), the intrapancreatic ductal network is less complex and secondary branches are missing in the mutants (D?D′) whereas they start to form by 100 hpf in wild-type larvae (arrowheads and insets, C?C′). (E′ ′′?F′ ′′) Higher magnifications of the area marked by dashed squares in (E?F′) show that at 120 hpf the main duct forms secondary branches (arrowheads) in wild-type larvae (E′′?E′ ′′), whereas in the mutants, secondary branches remain absent and clusters of ductal cells are sometimes observed (F′′?F′ ′′). (A?F) All images are projections of confocal z-stacks. Ventral views, anterior (A) to the top. Scale bars, 50 μm. (G) Graph representing the number of Tg(Tp1bglob:GFP);Tg(Tp1bglob:H2B-mCherry)-double positive cells (average�SEM) in the intrapancreatic ducts of wild-type and sox9b mutant larvae at different time points. 7 to 11 larvae of each genotype were counted at each stage. (H) Graph representing the area (in arbitrary unit, a.u.) of the primary islet (average�SEM) of TgBAC(neurod:GFP) wild-type and sox9b mutant larvae (7 dpf) and juvenile animals (2, 3 and 4 weeks (wks)). 6 to 11 animals of each genotype were analyzed at each stage. Area of primary islet was determined using ImageJ. (I) Graph representing the number of TgBAC(neurod:GFP)-positive cells/clusters (average�SEM) along the intrapancreatic ducts (IPD) in wild-type and sox9b mutant larvae (10 dpf) and juvenile animals. 7 to 11 animals of each genotype were analyzed at each stage. Asterisks indicate statistical significance: *p<0.05; |
| Fish: | |
|---|---|
| Observed In: | |
| Stage Range: | Protruding-mouth to Days 21-29 |