- Title
-
Lgl2 and E-cadherin act antagonistically to regulate hemidesmosome formation during epidermal development in zebrafish
- Authors
- Sonawane, M., Martin-Maischein, H., Schwarz, H., and Nüsslein-Volhard, C.
- Source
- Full text @ Development
|
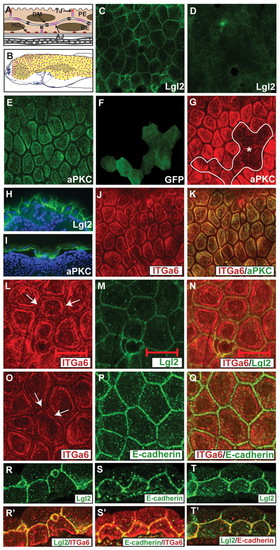
The localisation of Lgl2, aPKC, Itga6 and E-cadherin in 4- to 5-day-old zebrafish basal epidermis. (A,B) Schematic representation of the zebrafish bi-layered epidermis (A) and the epidermal region of 5-day-old larvae (B), which exhibits hemidesmosomes (red dots). (C-T′) Immunostaining using anti-Lgl2 (C,D,H,M,R,T), anti-aPKC (E,G,I,K), anti-GFP (F), anti-Itga6 (J,K,L,O,R′,S′) and anti-E-cadherin (P,S) antibodies. In the basal epidermis, Lgl2 localises to the lateral domain (C,H). Control lgl2 mutant epidermis does not show any specific Lgl2 staining (D). By contrast, aPKC is localised to the basal domain (E,I). Epidermal clones injected with a morpholino against aPKCλ (F) exhibit a reduction in aPKC expression (G). At the basal domain, Itga6 (J,K) and aPKC (K) co-localise. Co-staining of Itga6 and Lgl2 in whole-mounts (L-N) and sections (R,R′), and of Itga6 and E-cadherin in whole-mounts (O-Q) and sections (S,S′), reveals that a minor Itga6 fraction is localised at the lateral domain (arrows in L,O). Co-staining of Lgl2 and E-cadherin in sections reveals an overlap in their localisation (T,T′). Asterisk, basal epidermal clone. PE, periderm; BE, basal epidermis; AJ, adherens junctions; DM, desmosomes; HD, hemidesmosomes; TJ, tight junctions. Scale bar: 40 μm in C-G,J,K; 22.5μm in H,I; 20μm in L-T′. |
|
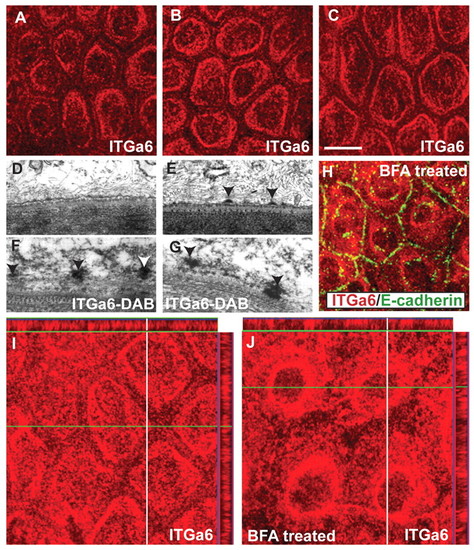
Dynamics of hemidesmosome formation in the zebrafish epidermis. (A-C) Immunostaining using anti-Itga6 antibody in wild-type larvae analysed at 3, 4 and 5 dpf in whole-mount. The localisation of Itga6 to the basal domain increases, while at the lateral domain it progressively decreases during 3-5 dpf. (D-G) Electron microscopy (D,E) and immunoelectron microscopy using anti-Itga6 antibody and nickel-enhanced DAB (F,G) in wild type. Electron-dense hemidesmosomes (arrowheads) are absent from the epidermis at 3 dpf (D) but present at 4 dpf (E). Itga6 localises to intermediate filaments (arrowheads) at 3.5-dpf (F). At 4 dpf, Itga6 becomes incorporated in hemidesmosomes (G). (H) Co-immunostaining using anti-Itga6 (red) and E-cadherin (green) antibodies. (I,J) Immunostaining using anti-Itga6 antibody followed by analysis in x-y and x-z planes. The basally localised Itga6 (I) accumulates around the nucleus after BFA treatment (H,J). Scale bar: 13.5 μm in A-C,H; 200 nm in D-G. |
|
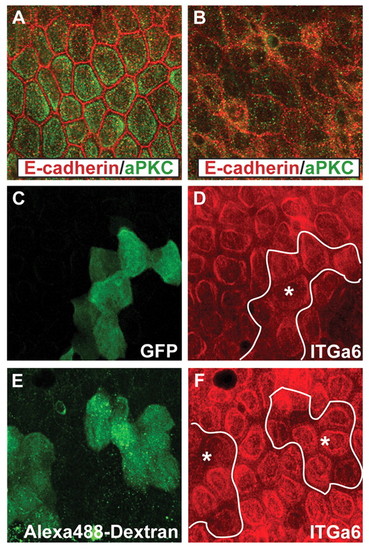
The function of aPKC is dispensable for Itga6 localisation. Co-immunostaining in zebrafish larvae at 5-6 dpf using (A,B) anti-aPKC (green) and anti-E-cadherin (red) antibodies, (C,D) anti-GFP (green) and anti-Itga6 (red) antibodies, and (E,F) anti-Alexa 488 (green) and Itga6 (red) antibodies. The basal aPKC localisation in wild-type larvae (A) is lost in 5-day-old lgl2 mutant larvae (B). The aPKCMO clone marked with GFP (C), and has (prkci) clones marked with Alexa 488-dextran (E), show normal Itga6 localisation (D,F) at 6 dpf. Asterisk, basal epidermal clone. |
|
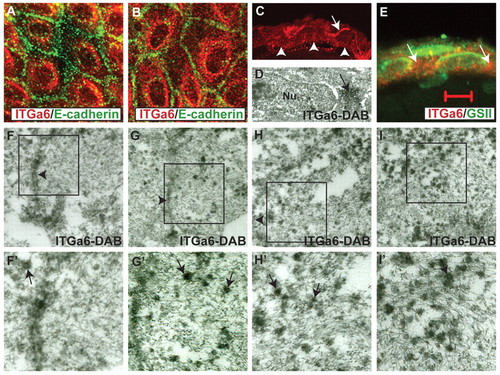
Lgl2 mediates targeting of Itga6 to the plasma membrane during hemidesmosome formation in basal epidermal cells. (A-C,E) Immunostaining of lgl2 mutant epidermis with anti-Itga6 (red) and anti-E-cadherin (green) antibodies (A,B), anti-Itga6 antibody (C), or anti-Itga6 antibody (red) and lectin GS II (green) in section (E). In mutant larvae at 4-5 dpf, Itga6 exhibits diffuse cytoplasmic staining along with strong perinuclear accumulation (A,B). This perinuclear Itga6 staining is not due to Itga6 accumulation in the Golgi apparatus (E). Basal and lateral Itga6 localisation is lost in lgl2 larvae (C); arrowheads mark the basal domain and the arrow marks the apical domain juxtaposed to a peridermal cell where the Itga6 staining occasionally persists. (D,F-I′) Immunoelectron microscopy using anti-Itga6 antibody and nickel-enhanced DAB in wild-type (F,F′) and lgl2 mutant (D,G-I′) larvae. F′-I′ are 2x enlargements of the boxed regions in F-I. The perinuclear accumulation of Itga6 is evident in immunoelectron micrographs (arrow in D). In wild-type larval epidermis at 4 dpf, electron-dense Itga6 vesicles are relatively rare (F) around the lateral domain. By contrast, in lgl2 mutant larvae at 4 dpf, Itga6 vesicles are frequently present in the lateral cortex (G,H) and in the cytoplasm in general (I). Arrowheads in F-I indicate the lateral domain. In F′-I′, some of the Itga6 vesicles are indicated by arrows. Scale bar: 13.5 μm in A,B; 27 μm in C; 5 μm in E; 200 nm in F-I. |
|
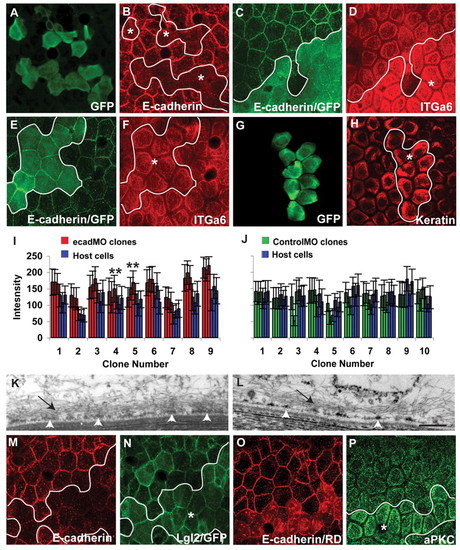
The loss of E-cadherin function results in augmented localisation of Itga6 and increased hemidesmosome formation in the basal domain. (A-H) Immunostaining with anti-GFP, anti-E-cadherin, anti-Itga6 and anti-keratin antibodies as labelled. e-cadherin morpholino (ecadMO) clones (A) show consistent knockdown of E-cadherin in 5-day-old larvae (B). The knockdown of E-cadherin in clones (C) results in the enhanced localisation of Itga6 at the basal domain in 6-day-old larvae (D). The control morpholino clones (E), do not show any increase in Itga6 localisation to the basal domain (F). Furthermore, ecadMO clones (G) also exhibit enhanced localisation of hemidesmosomal keratin (H). Asterisks, epidermal clones. (I,J) Quantification of Itga6 signal intensity in ecadMO and control morpholino (controlMO) clones and surrounding host cells at 6 dpf. The mean intensity per cell is shown with s.d. This quantification reveals that in ecadMO clones, signal intensities for Itga6 are consistently higher than in the host cells (I), whereas in control morpholino clones they are not (J). Three comparisons out of nine (in clone number 4) and one comparison out of nine (in clone number 5) were not statistically significant by Student's t-test (**P≤0.05). (K,L) Electron micrograph of an ecadMO clonal cell (K) and control wild-type cell in the same region (L). In ecadMO clones, hemidesmosomes coalesce to form electron-dense mats (arrowheads in K), which contrast with electron-dense punctae in control cells at 6 dpf (arrowheads in L). Note the macrofilaments projecting out of the hemidesmosomal mats and punctae (arrows). (M-P) Co-immunostaining using anti-E-cadherin (M) and anti-Lgl2 (N) antibodies, or anti-E-cadherin (O) and anti-aPKC (P) antibodies. e-cadherin knockdown in the basal epidermis (M) does not alter the localisation of Lgl2 at 5 dpf (N). However, ecadMO clones (O) do exhibit increased localisation of aPKC to the basal domain (P). In C,E,H, the cytoplasmic green fluorescence represents GFP, whereas in O the cytoplasmic red fluorescence represents Rhodamine-dextran (RD). Our fixation conditions do not lead to complete quenching of GFP and Rhodamine fluorescence. Scale bar: 27 μm in A-H; 270 nm in K,L. |
|
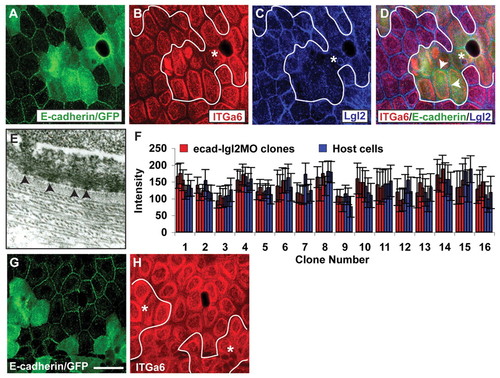
The reduction of Lgl2 levels in ecadMO clones rescues the hemidesmosomal phenotype. (A-D) Co-immunostaining using anti-E-cadherin/GFP (A), anti-Itga6 (B) and anti-Lgl2 (C) antibodies and overlay (D). In ecadMO clones (A), Itga6 does not show enhanced localisation at 6 dpf (B) when Lgl2 levels (C) are reduced by co-injecting lgl2 morpholino. Note that Lgl2 is not completely absent after injection of suboptimal concentrations (100 μM) of lgl2 morpholino (arrowheads in D). Quantification of signal intensities reveals that there are no significant differences in the Itga6 intensities in clonal cells and surrounding host cells (D). Asterisks, epidermal clones. In A and E, the cytoplasmic green fluorescence represents GFP. Our fixation conditions do not lead to complete quenching of GFP fluorescence. (E) Electron micrograph of lgl2-ecadMO clone. (F) The signal intensity for Itga6 was quantified from three host cells and from three cells per clone that received e-cadherin as well as lgl2 (at suboptimal concentrations) morpholinos. The mean intensity for each cell and the standard error are shown. (G,H) Co-immunostaining using anti-E-cadherin (G) and anti-Itga6 (H). This clonal analysis in 3.5-day-old larvae reveals that ecadMO clones (G) do not exhibit enhanced localisation of Itga6 at the basal or lateral domain (H). Scale bar: 27 μm in A-D,G,H; 270 nm in E. |
|
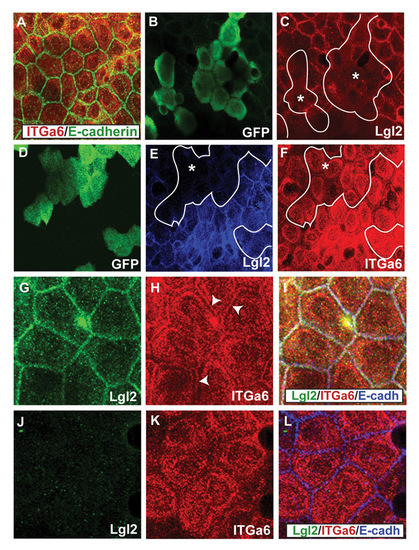
Early localisation of Itga6 in lgl2 mutants and lgl2 morphant clones. (A-F) Co-immunostaining using anti-Itga6 (red) and anti-E-cadherin (A) antibodies; anti-GFP (B) and anti-Lgl2 (C) antibodies; anti-GFP (D), anti-Lgl2 (E) and anti-Itga6 (F) antibodies. The localisation of Itga6 is not altered in the basal epidermis of lgl2 larvae at 3 dpf (A). In the basal epidermal clones marked with GFP (B), lgl2 morpholino specifically knockdowns Lgl2 expression (C). In GFP-marked basal epidermal clones (D), wherein Lgl2 expression is attenuated (E), Itga6 localisation at the basal and lateral domains remains unperturbed. (G-L) Co-immunostainings using anti-Lgl2 (G,J), anti-Itga6 (H,K) and anti-E-cadherin (blue in the overlays; I,L) antibodies. In comparison to wild type (G-I), in the lgl2 mutant (J-L) at 3.75 dpf lateral Itga6 localisation is selectively altered. Asterisks, epidermal clones. Arrowheads in H mark the lateral Itga6 localisation in wild-type basal epidermis. |

