- Title
-
Neural protein Olig2 acts upstream of the transcriptional regulator sim1 to specify diencephalic dopaminergic neurons
- Authors
- Borodovsky, N., Ponomaryov, T., Frenkel, S., and Levkowitz, G.
- Source
- Full text @ Dev. Dyn.
|
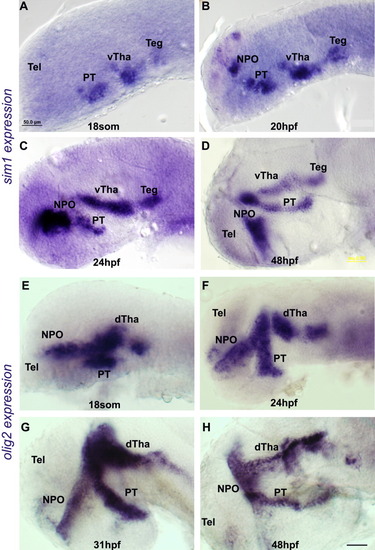
Expression of sim1 and olig2 at different developmental stages. Micrographs of zebrafish embryos stained by whole mount in situ hybridization procedure using (A-D) Sim1 RNA probe and (E-H) Olig2 RNA probe. The different developmental stages are indicated. All images presented in lateral view, anterior to the left. dTha, dorsal thalamus; NPO, neurosecretory preoptic area; PT, posterior tuberculum; Teg, tegmentum; Tel, telencephalon; vTha, ventral thalamus. Scale bar = 50 μm. EXPRESSION / LABELING:
|
|
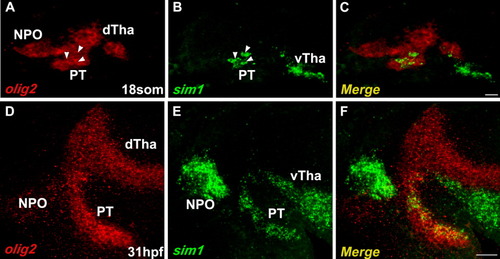
Simultaneous expression analysis of sim1 and olig2 transcripts. Double fluorescent whole mount in situ hybridization of zebrafish embryos using digoxigenin (DIG)-labeled sim1 RNA probe (green) and fluorescein (FITC)-labeled olig2 RNA probe (red) at (A-C) 18 somites (som) and (D-F) 31 hr post fertilization (hpf). All images presented in lateral view, anterior to the left. dTha, dorsal thalamus; NPO, neurosecretory preoptic area; PT, posterior tuberculum; vTha, ventral thalamus. Scale bars = 36 μm in A-C; 22 μm in D-F. EXPRESSION / LABELING:
|
|
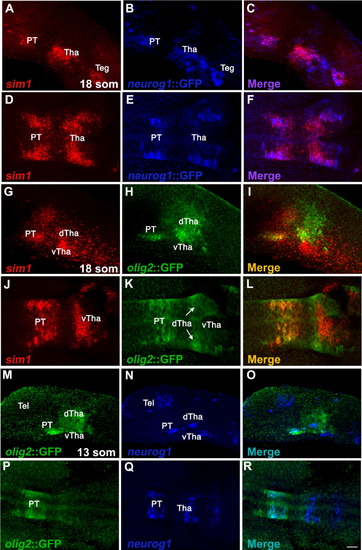
sim1 and olig2 are co-expressed in the prospective posterior tuberculum. A-L: Spatial expression analyses of sim1 in transgenic reporter lines expressing GFP, which is driven by the respective olig2 (olig2::GFP) or neurog1 (neurog1::GFP) promoters. The expression of sim1 mRNA was visualized using fluorescent in situ hybridiztion (red) followed by detection of either olig2- or neurog1-expressing cells with anti-GFP antibody. For the purpose of clarity, the expression of neurog1::GFP is visualized in pseudo color (blue). M-R: Whole mount fluorescent in situ hybridiztion of neurog1 (blue, pseudo color) followed by immunofluorescent staining of GFP, which marks olig2-expressing cells (green). A-C, G-I, M-O: Lateral view, anterior to the left; D-F, J-L, P-R: dorsal view, anterior to the left. dTha, dorsal thalamus; PT, posterior tuberculum; Teg, tegmentum; Tel, telencephalon Tha, thalamus; vTha, ventral thalamus. Scale bar = 36 μm. EXPRESSION / LABELING:
|
|
sim1, but not olig2, is expressed in mature DA neurons. A-L: Whole mount in situ hybridization (red) of either Sim1 (A-F) or Olig2 (G-L) followed by anti-TH immunohistochemistry (blue). M-O: Transgenic embryos expressing GFP (green) under the control of the olig2 promoter (Olig2::gfp) stained with anti-TH antibody (blue, pseudo color). A-C, G-I: Dorsal view; D-F, J-O: lateral view. hpf, hours post fertilization; NPO, neurosecretory preoptic area; PT, posterior tuberculum; Tel, telencephalon, Tha, thalamus. Scale bar: 22.5 μm. |
|
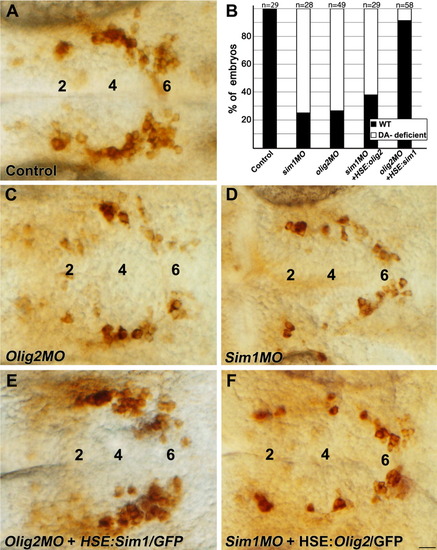
Olig2 acts upstream to Sim1 in the control of DA specification. A, C-F: High-resolution micrographs (dorsal view, anterior to the left) displaying representative images of embryos from each treatment. At 52 hr post fertilization (hpf), embryos were fixed and subjected to immunostaining with an anti-TH antibody. Embryos were injected with sim1 MO (D,F) or olig2 MO (C,E). For the rescue analysis, embryos were injected with heat shock-inducible plasmid constructs containing either the sim1 (HSE:Sim1/GFP; E) or olig2 (HSE:Olig2/GFP; F) coding sequence. Expression of sim1 and olig2 was induced by shifting the embryos to the permissive temperature as described in the Experimental Procedures section. The amount of injected DNA HSE constructs in Olig2 and Sim1 gain-of-function experiments was determined by titrating the minimal doses of DNA that induce efficient ectopic RNA and GFP expression. B: Stacked bar chart representing the percentage of embryos displaying aberrant DA phenotype (denoted “DA- deficient”). Effects of the various genetic perturbations on DA neurons were scored and analyzed as described in the Experimental Procedures section. The number of embryos analyzed (n) is shown above. The major diencephalic DA groups 2, 4, and 6 are indicated. Scale bar = 25 μm. PHENOTYPE:
|
|
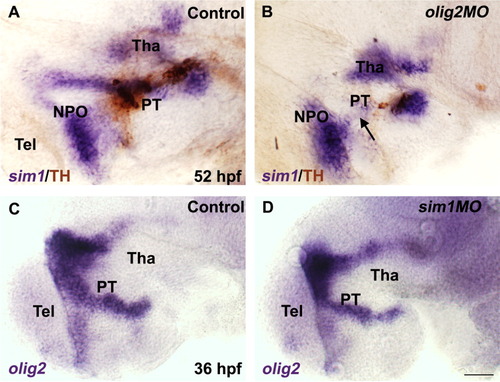
Loss of olig2 gene function affects the expression of sim1. A,B: Embryos injected with olig2 MO were subjected to whole mount in situ hybridization with antisense sim1 RNA probe (purple), followed by immuno-staining with anti-TH antibody to detect DA neurons (brown). C,D: Embryos injected with sim1 MO were subjected to whole mount in situ hybridization with olig2 RNA probe (purple). Black arrowhead marks deficient Sim1 expression domain in the PT. All images are presented in lateral view, anterior to the left. NPO, neurosecretory preoptic area; PT, posterior tuberculum; Tel, telencephalon; Tha, thalamus. Scale bar = 50 μm. |
|
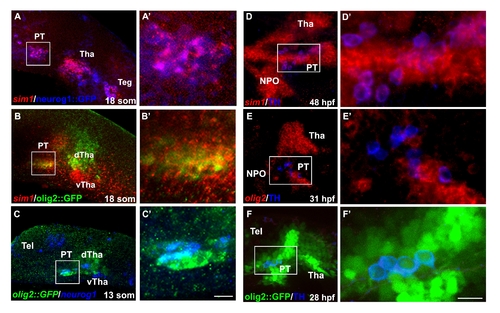
Co-expression of Sim1 and Olig2 with Neurog1 and DA neurons in the posterior tuberculum. (A,B) Spatial expression analyses of sim1 in transgenic reporter lines expressing GFP, which is driven by the respective olig2(olig2::GFP) or neurog1 (neurog1::GFP) promoters. The expression of sim1 mRNA was visualized using fluorescent in-situ hybridization (red) followed by detection of either olig2- or neurog1-expressing cells with anti-GFP antibody. For the purpose of clarity, the expression of neurog1::GFP is visualized in pseudo color (blue). (C) Whole mount fluorescent in-situ hybridiztion of neurog1 (blue, pseudo color) followed by immunofluorescent staining of GFP which marks olig2-expressing cells. (D,E) Expression of sim1 and olig2 (red) followed by anti-TH immunohistochemistry (blue). (F) Transgenic embryos expressing GFP (green) under the control of the olig2 promoter (olig2::gfp) stained with anti-TH antibody (blue, pseudo color). (A′-F′) High magnification images of the posterior tuberculum area. The area of magnification is marked by a white square. dTha, dorsal thalamus; hpf, hours post fertilization; NPO; neurosecretory preoptic area PT, posterior tuberculum; som, somites; Teg, tegmentum; Tel, telencephalon Tha, thalamus; vTha, ventral thalamus. All images presented in lateral view, anterior to the left. Scale bars: (A′-C′) 18 μm; (D′-F′) 11.25 μm. |
|
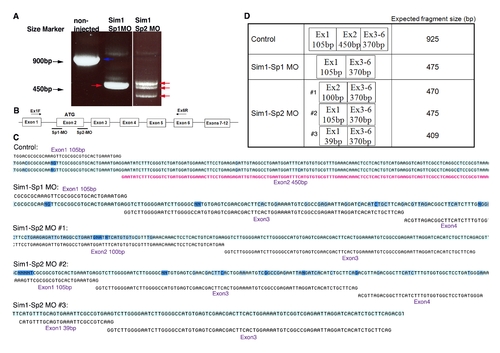
Effects of Sim1 directed splice-blocking morpholinos. (A) Gel electrophoresis image showing altered RNA splicing products in embryos injected with splice-blocking morpholinos (MO; denoted Sim1 Sp1 and Sim1 Sp2). The blue arrow points to the correctly spliced mRNA, whereas red arrows indicate altered splicing products. (B) Scheme depicting Sim1 gene structure as well as antisense MO binding sites and the PCR primers used to amplify the various sim1 mRNA products. (C) Sim1 cDNA was amplified using reverse transcriptase-based PCR of total mRNA isolated from the control and MO injected embryos followed by nucleotide sequencing of the gel-excised DNA fragments. Obtained sequences (light blue) were compared to the correct form of Sim1 mRNA (black). Exon numbers and sizes are indicated. (D) A table summarizing the expected mRNA size in the control and MO injected embryos. |
|
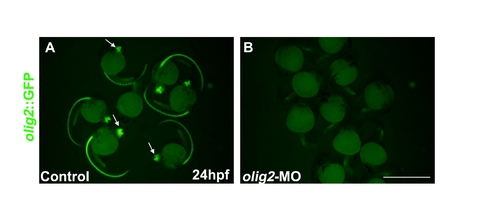
Effects of Olig2ATG-directed morpholino (MO). Fluorescent images of (A) control and (B) Olig2 MO injected Olig2::GFP transgenic live embryos at 24 hours post fertilization (hpf). Strong GFP expression is detected in the control embryos (white arrows) while no GFP is found in the MO injected embryos. Note that the contrast was artificially enhanced in image displaying MO injected embryos (panel B) to compensate for complete lack of fluorescence. Scale bar: 200 μm. |
|
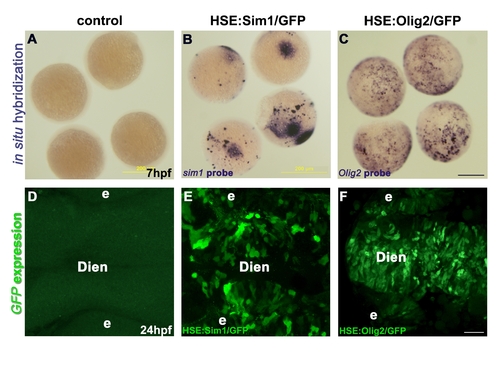
Efficiency of Sim1 and Olig2 temperature- inducible constructs. Embryos were injected with either HSE:Sim1/GFP (B,E) or HSE:Olig2/GFP (C,F) DNA constructs. At 5 hours post fertilization (hpf), embryos were incubated at either a non-permissive temperature (28° C; A,D) or a permissive temperature (37°C; B,C,E,F) for 45 minutes, to induce gene expression. Embryos at 7 hpf stage were analyzed for expression of sim1 (B) or olig2 (C) by whole mount in-situ hybridization using sim1 and olig2 RNA probes. (D-F) Projected confocal z-stack images (24hpf) of GFP expression driven by the bi-directional heat shock element (HSE). Note that the contrast was artificially enhanced in image displaying the control embryo (panel D) to compensate for complete lack of fluorescence. Dien, diencephalon; e, eye. Scale bars: (A-C) 100 μm; (D-F) 22 μm. |
|
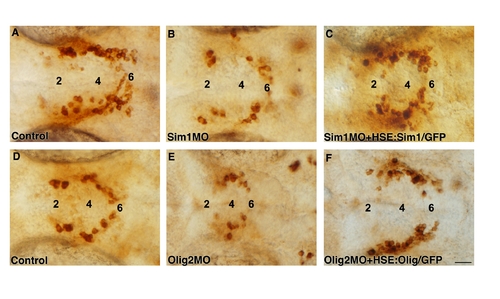
Gain of function of Sim1 and Olig2 rescues the respective morphant phenotypes. High-resolution micrographs of embryos at 52 hours post fertilization (dorsal view, anterior to the left) that were immunostained with an anti-TH antibody. Diencephalic DA groups are marked. Embryos were injected with antisense morpholinos directed against either sim1 (Sim1MO; B, C) or olig2 (Olig2MO; E, F) in the absence (B,E) or presence (C,F) of HSE:Sim1/GFP or HSE:Olig2/GFP constructs. Temperature induced gene expression was performed as described in the legend for Supp. Fig. S4. Scale bar: 25 μm. |

