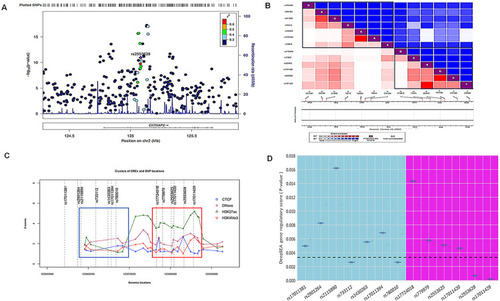
A. Regional Association Plot indicating the statistical strength of association among associated genomic region of CNTNAP5 gene with PACG after performing conditional analysis B. Bokeh plot shows the pairwise linkage disequilibrium between the 13 variants around the region of CNTNAP5 in two LD blocks C. CREs and SNPs plotted along with their genomic and epigenomic features of 13 SNPs of CNTNAP5. Based on the features, blue and red boxes are shown that roughly highlight SNP and CRE clusters. The elements and variants belonging to the red box show better likelihood for having functional relevance. D. The Whisker plot shows the DeepSEA gene regulatory score (P-value) of 13 SNPs of CNTNAP5. The plot includes a Bonferroni-corrected significance threshold line at 0.0038, indicating the adjusted significance level after correcting for multiple testing. SNPs below this threshold are considered statistically significant. Based on the features, blue (Cluster I) and pink (Cluster II) boxes are shown, representing different DeepSEA gene regulatory scores (P-values). The elements and variants belonging to the pink square have a better likelihood of having gene regulation potential.
|
