|
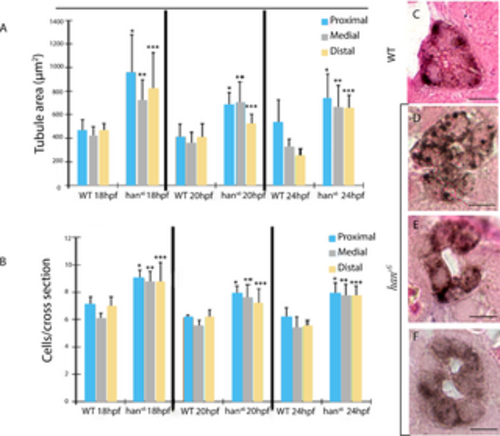
Comparison of morphometry parameters and tissue organization in WT and hans6 sections (along the anteroposterior axis) during tubulogenesis. A. Pronephric tubule area measurements and B, cell number per cross-section from 18 to 24 hpf in WT and hans6 embryos at three levels along AP axis. Significant differences were found between pairs of levels evaluated by phenotype (n = 18; p-value? 0.005; Dunn?s post-hoc test). Diverse defective settings of pronephric tubule organization were observed in comparison to the compacted cell assembly in WT embryos (C), such as erroneous location of cells outside the area of lumen formation (D), loss of tubule structural integrity (E), and two visible lumens (F) Scale bars: 20 ?m. Brown staining corresponds to ATP1a1a.4 expression pattern in pronephric tubule
|