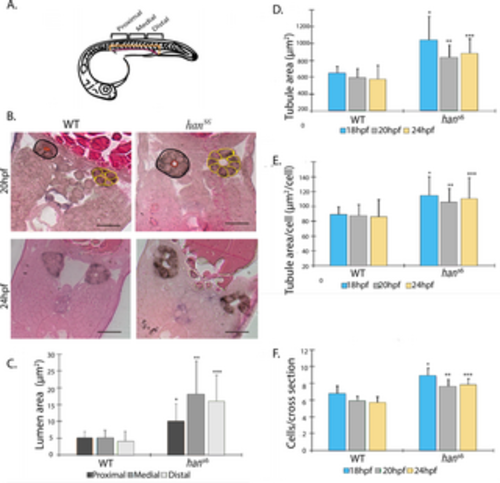
Cell and tissue characteristics of developing pronephric tubule in WT and hans6 embryos. A. Schematic of a 24hpf zebrafish embryo. Orientation of tissue sectioning was perpendicular to the A-P axis. B. Representative images of observed patterns at 20 and 24 hpf. Black circles indicate demarcated area of the tubules, red circles show the lumen and yellow circles show cells that constitute the tubules. It is possible to observe a higher cell number of cells, bigger tubule, and lumen areas in han mutants. C Lumen area differences at 24 hpf were significant along the A-P axis (n = 18; p-value? 0.001; Dunn?s post-hoc test). D. Tubule area differences between the two groups were significant at each evaluated stage (n = 18; p-value? 0.001; Dunn?s post-hoc test). E. The calculated index tubule area per cell number showed significant differences between pairs of categories at all development stages (n = 18; p-value? 0.001; Dunn?s post-hoc test). F Cell -counts per cross-section per stage showed significant differences between WT and hans6 embryos (n = 18; p-value? 0.001; Dunn?s post-hoc test).
|
