
FIGURE
Figure 7
- ID
- ZDB-FIG-240607-126
- Publication
- Fabian et al., 2024 - Comprehensive phenotypic characterization of an allelic series of zebrafish models of NEB-related nemaline myopathy
- Other Figures
- All Figure Page
- Back to All Figure Page
Figure 7
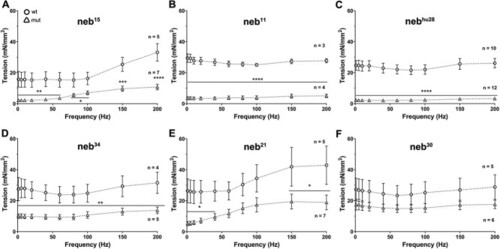
Force production is reduced in |
Expression Data
Expression Detail
Antibody Labeling
Phenotype Data
| Fish: | |
|---|---|
| Observed In: | |
| Stage: | Day 4 |
Phenotype Detail
Acknowledgments
This image is the copyrighted work of the attributed author or publisher, and
ZFIN has permission only to display this image to its users.
Additional permissions should be obtained from the applicable author or publisher of the image.
Full text @ Hum. Mol. Genet.