IMAGE

Figure 7

ID
ZDB-IMAGE-240607-123
Source
Figures for Fabian et al., 2024
Image
Figure Caption

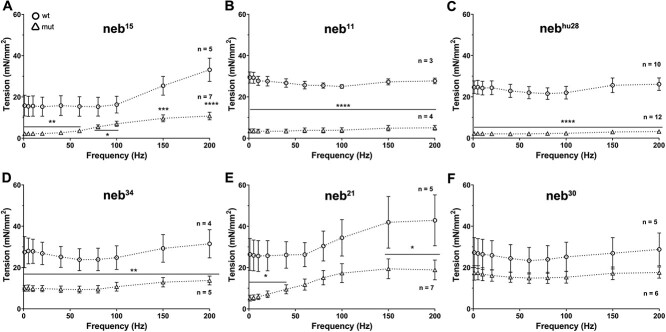
Figure 7

Force production is reduced in neb mutants. (A–F) Plots of force production at optimal length (mean ± SEM). Across all frequency range of stimulation (1–200 Hz), all of the mutants showed lower force production than the wt controls at optimal sarcomere length. The reduction in force production is significant in both nonsense mutants and the splice mutants nebhu28 and neb34. Asterisks indicate p-values (* ≤ 0.05; ** ≤ 0.01; *** ≤ 0.001; **** ≤ 0.0001). See Supplemental Table 4 for measurements and statistics.

Figure Data
Acknowledgments
This image is the copyrighted work of the attributed author or publisher, and ZFIN has permission only to display this image to its users. Additional permissions should be obtained from the applicable author or publisher of the image. Full text @ Hum. Mol. Genet.